Next: BoxPlot sample, Previous: Cones sample, Up: 1D samples [Contents][Index]
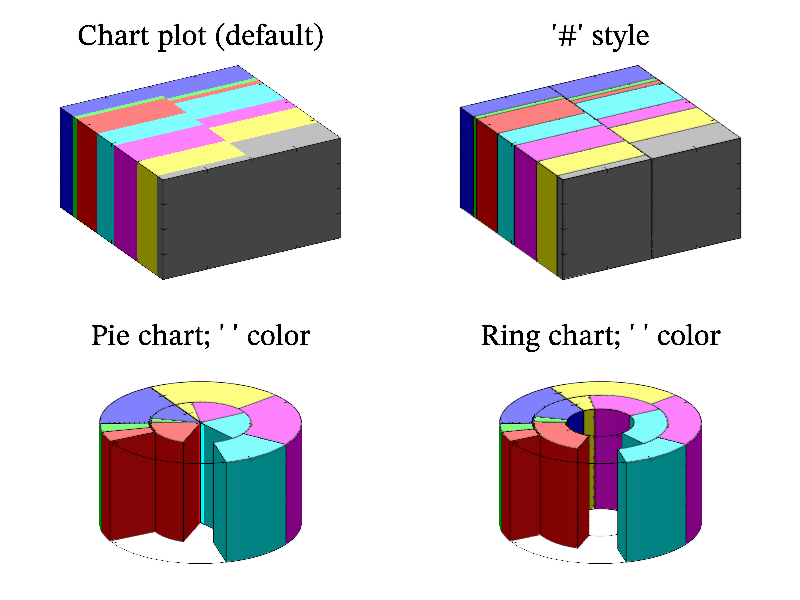
Function chart draw colored boxes with width proportional to data values. Use ‘ ’ for empty box. Plot looks most attractive in polar coordinates – well known pie chart. The sample code is:
int sample(mglGraph *gr)
{
  mglData ch(7,2);  for(int i=0;i<7*2;i++)  ch.a[i]=mgl_rnd()+0.1;
  gr->SubPlot(2,2,0); gr->Title("Chart plot (default)");
  gr->Light(true);  gr->Rotate(50,60);  gr->Box();  gr->Chart(ch);

  gr->SubPlot(2,2,1); gr->Title("'\\#' style");
  gr->Rotate(50,60);  gr->Box();  gr->Chart(ch,"#");

  gr->SubPlot(2,2,2); gr->Title("Pie chart; ' ' color");
  gr->SetFunc("(y+1)/2*cos(pi*x)","(y+1)/2*sin(pi*x)","");
  gr->Rotate(50,60);  gr->Box();  gr->Chart(ch,"bgr cmy#");

  gr->SubPlot(2,2,3); gr->Title("Ring chart; ' ' color");
  gr->SetFunc("(y+2)/3*cos(pi*x)","(y+2)/3*sin(pi*x)","");
  gr->Rotate(50,60);  gr->Box();  gr->Chart(ch,"bgr cmy#");
  return 0;
}