3.5.12 Making histogram 
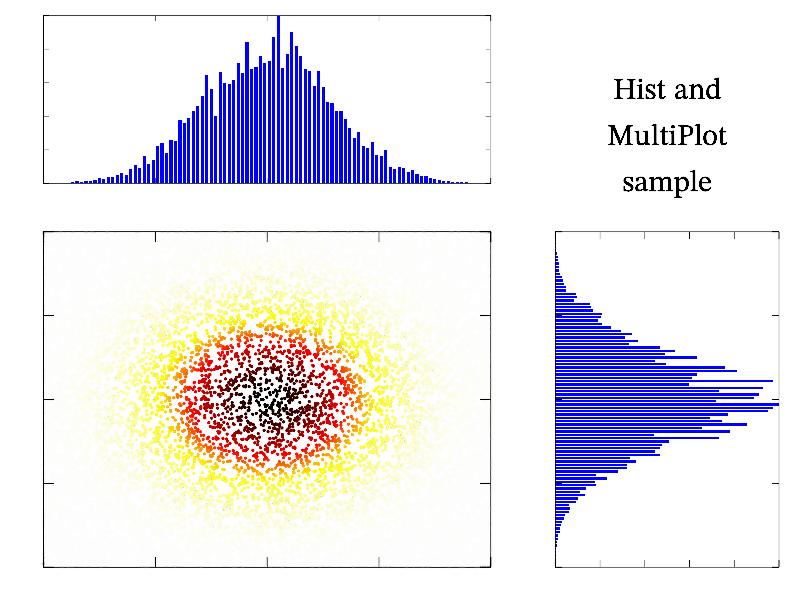
Using the hist function(s) for making regular distributions is one of useful fast methods to process and plot irregular data. Hist can be used to find some momentum of set of points by specifying weight function. It is possible to create not only 1D distributions but also 2D and 3D ones. Below I place the simplest sample code which demonstrate hist usage:
int sample(mglGraph *gr)
{
  mglData x(10000), y(10000), z(10000);  gr->Fill(x,"2*rnd-1");
  gr->Fill(y,"2*rnd-1"); gr->Fill(z,"exp(-6*(v^2+w^2))",x,y);
  mglData xx=gr->Hist(x,z), yy=gr->Hist(y,z);	xx.Norm(0,1);
  yy.Norm(0,1);
  gr->MultiPlot(3,3,3,2,2,"");   gr->SetRanges(-1,1,-1,1,0,1);
  gr->Box();  gr->Dots(x,y,z,"wyrRk");
  gr->MultiPlot(3,3,0,2,1,"");   gr->SetRanges(-1,1,0,1);
  gr->Box();  gr->Bars(xx);
  gr->MultiPlot(3,3,5,1,2,"");   gr->SetRanges(0,1,-1,1);
  gr->Box();  gr->Barh(yy);
  gr->SubPlot(3,3,2);
  gr->Puts(mglPoint(0.5,0.5),"Hist and\nMultiPlot\nsample","a",-6);
  return 0;
}
