Next: Stem sample, Previous: Area sample, Up: 1D samples [Contents][Index]
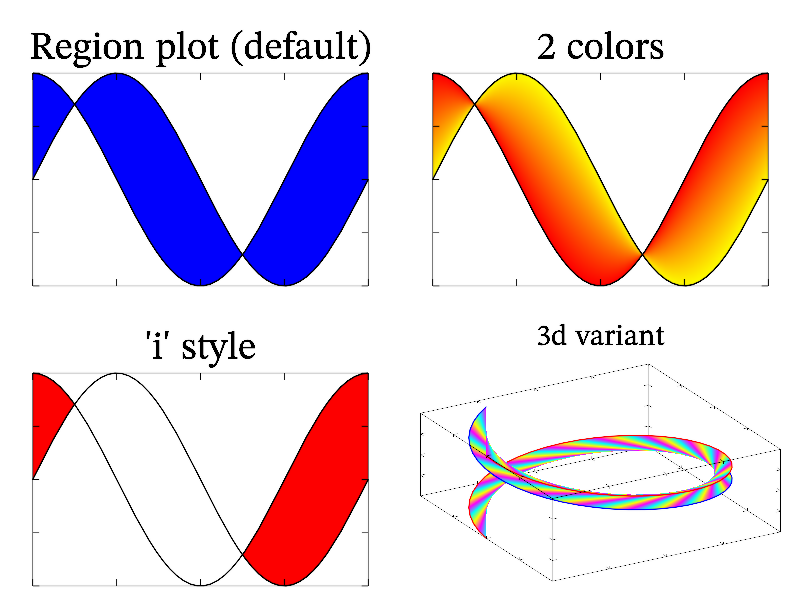
Function region fill the area between 2 curves. It support gradient filling if 2 colors per curve is specified. Also it can fill only the region y1<y<y2 if style ‘i’ is used. The sample code is:
int sample(mglGraph *gr)
{
  mglData y;  mgls_prepare1d(&y);
  mglData y1 = y.SubData(-1,1), y2 = y.SubData(-1,2);  gr->SetOrigin(0,0,0);

  gr->SubPlot(2,2,0,"");  gr->Title("Region plot (default)"); gr->Box();
  gr->Region(y1,y2);  gr->Plot(y1,"k2");  gr->Plot(y2,"k2");

  gr->SubPlot(2,2,1,"");  gr->Title("2 colors");  gr->Box();
  gr->Region(y1,y2,"yr"); gr->Plot(y1,"k2");  gr->Plot(y2,"k2");

  gr->SubPlot(2,2,2,"");  gr->Title("'i' style");  gr->Box();
  gr->Region(y1,y2,"ir"); gr->Plot(y1,"k2");  gr->Plot(y2,"k2");

  gr->SubPlot(2,2,3,"^_");  gr->Title("3d variant");  gr->Rotate(40,60);  gr->Box();
  gr->Fill(y1,"cos(pi*x)"); gr->Fill(y2,"cos(pi*x+pi/3)");
  mglData x1(y1.nx), x2(y1.nx), z(y1.nx);
  gr->Fill(x1,"sin(pi*x)"); gr->Fill(x2,"sin(pi*x+pi/3)");  gr->Fill(z,"x");
  gr->Plot(x1,y1,z,"r2");   gr->Plot(x2,y2,z,"b2");
  gr->Region(x1,y1,z,x2,y2,z,"cmy!");
  return 0;
}
Next: Stem sample, Previous: Area sample, Up: 1D samples [Contents][Index]