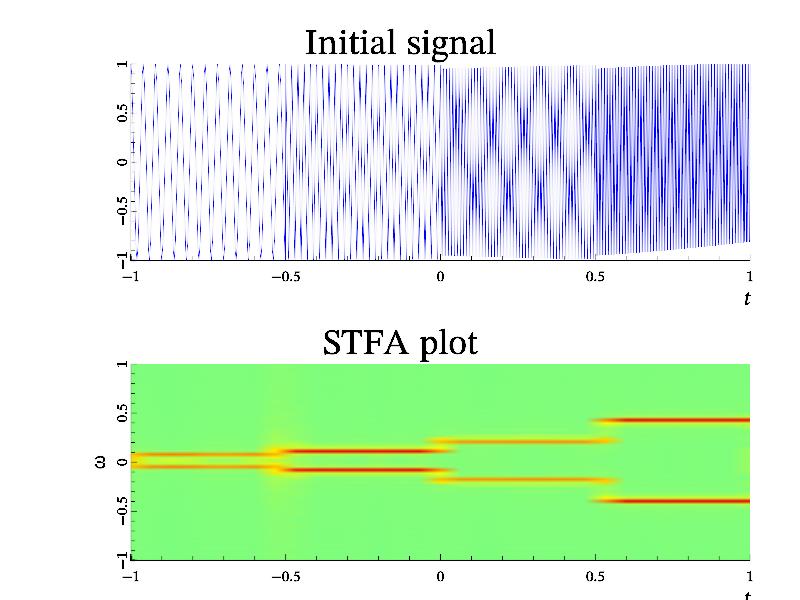
3.5.8 STFA sample 
Short-time Fourier Analysis (stfa) is one of informative method for analyzing long rapidly oscillating 1D data arrays. It is used to determine the sinusoidal frequency and phase content of local sections of a signal as it changes over time.
MathGL can find and draw STFA result. Just to show this feature I give following sample. Initial data arrays is 1D arrays with step-like frequency. Exactly this you can see at bottom on the STFA plot. The sample code is:
int sample(mglGraph *gr)
{
  mglData a(2000), b(2000);
  gr->Fill(a,"cos(50*pi*x)*(x<-.5)+cos(100*pi*x)*(x<0)*(x>-.5)+\
  cos(200*pi*x)*(x<.5)*(x>0)+cos(400*pi*x)*(x>.5)");
  gr->SubPlot(1, 2, 0,"<_");  gr->Title("Initial signal");
  gr->Plot(a);
  gr->Axis();
  gr->Label('x', "\\i t");

  gr->SubPlot(1, 2, 1,"<_");  gr->Title("STFA plot");
  gr->STFA(a, b, 64);
  gr->Axis();
  gr->Label('x', "\\i t");
  gr->Label('y', "\\omega", 0);
  return 0;
}
