Next: Dots sample, Previous: ContF projection sample, Up: 3D samples [Contents][Index]
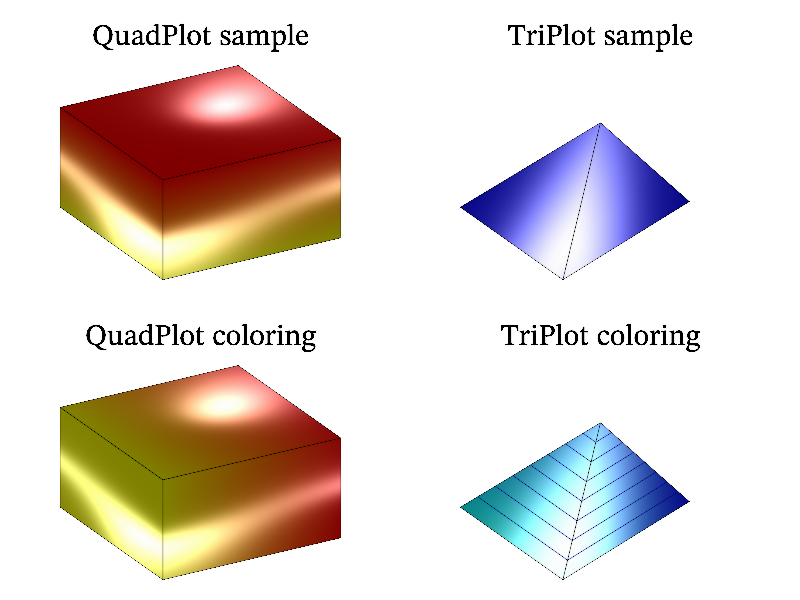
Function triplot and quadplot draw set of triangles (or quadrangles for QuadPlot) for irregular data arrays. Note, that you have to provide not only vertexes, but also the indexes of triangles or quadrangles. I.e. perform triangulation by some other library. The sample code is:
int sample(mglGraph *gr)
{
  mreal q[] = {0,1,2,3, 4,5,6,7, 0,2,4,6, 1,3,5,7, 0,4,1,5, 2,6,3,7};
  mreal xc[] = {-1,1,-1,1,-1,1,-1,1}, yc[] = {-1,-1,1,1,-1,-1,1,1}, zc[] = {-1,-1,-1,-1,1,1,1,1};
  mglData qq(6,4,q), xx(8,xc), yy(8,yc), zz(8,zc);
  gr->Light(true);  //gr->Alpha(true);
  gr->SubPlot(2,2,0); gr->Title("QuadPlot sample"); gr->Rotate(50,60);
  gr->QuadPlot(qq,xx,yy,zz,"yr");
  gr->QuadPlot(qq,xx,yy,zz,"k#");
  gr->SubPlot(2,2,2); gr->Title("QuadPlot coloring"); gr->Rotate(50,60);
  gr->QuadPlot(qq,xx,yy,zz,yy,"yr");
  gr->QuadPlot(qq,xx,yy,zz,"k#");

  mreal t[] = {0,1,2, 0,1,3, 0,2,3, 1,2,3};
  mreal xt[] = {-1,1,0,0}, yt[] = {-1,-1,1,0}, zt[] = {-1,-1,-1,1};
  mglData tt(4,3,t), uu(4,xt), vv(4,yt), ww(4,zt);
  gr->SubPlot(2,2,1); gr->Title("TriPlot sample");  gr->Rotate(50,60);
  gr->TriPlot(tt,uu,vv,ww,"b");
  gr->TriPlot(tt,uu,vv,ww,"k#");
  gr->SubPlot(2,2,3); gr->Title("TriPlot coloring");  gr->Rotate(50,60);
  gr->TriPlot(tt,uu,vv,ww,vv,"cb");
  gr->TriPlot(tt,uu,vv,ww,"k#");
  gr->TriCont(tt,uu,vv,ww,"B");
  return 0;
}
Next: Dots sample, Previous: ContF projection sample, Up: 3D samples [Contents][Index]