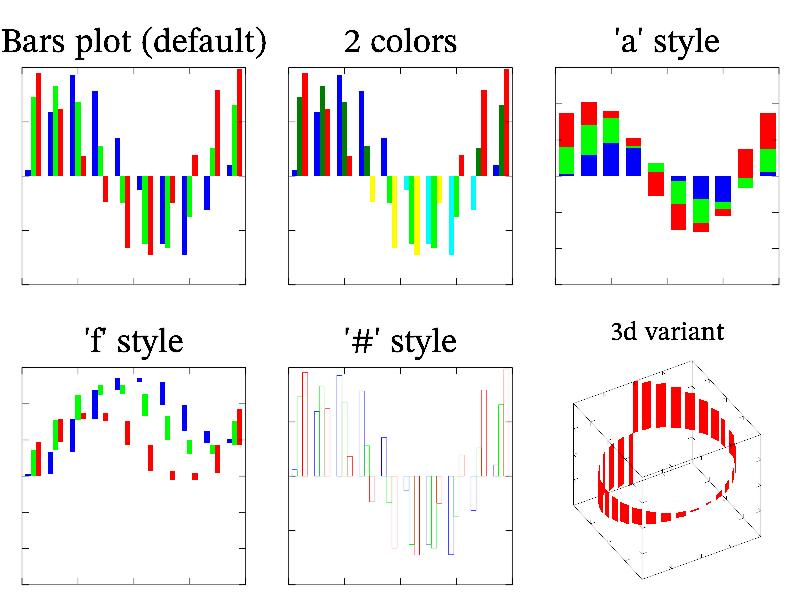
11.11 Sample ‘bars’ 
Function bars draw vertical bars. It have a lot of options: bar-above-bar (‘a’ style), fall like (‘f’ style), 2 colors for positive and negative values, wired bars (‘#’ style), 3D variant.
MGL code:
new ys 10 3 '0.8*sin(pi*(x+y/4+1.25))+0.2*rnd':origin 0 0 0
subplot 3 2 0 '':title 'Bars plot (default)':box:bars ys
subplot 3 2 1 '':title '2 colors':box:bars ys 'cbgGyr'
subplot 3 2 4 '':title '"\#" style':box:bars ys '#'
new yc 30 'sin(pi*x)':new xc 30 'cos(pi*x)':new z 30 'x'
subplot 3 2 5:title '3d variant':rotate 50 60:box:bars xc yc z 'r'
ranges -1 1 -3 3:subplot 3 2 2 '':title '"a" style':box:bars ys 'a'
subplot 3 2 3 '':title '"f" style':box:bars ys 'f'
C++ code:
void smgl_bars(mglGraph *gr)
{
	mglData ys(10,3);	ys.Modify("0.8*sin(pi*(2*x+y/2))+0.2*rnd");
	gr->SetOrigin(0,0,0);
	if(big!=3)	{	gr->SubPlot(3,2,0,"");	gr->Title("Bars plot (default)");	}
	gr->Box();	gr->Bars(ys);
	if(big==3)	return;
	gr->SubPlot(3,2,1,"");	gr->Title("2 colors");	gr->Box();	gr->Bars(ys,"cbgGyr");
	gr->SubPlot(3,2,4,"");	gr->Title("'\\#' style");	gr->Box();	gr->Bars(ys,"#");
	gr->SubPlot(3,2,5);	gr->Title("3d variant");	gr->Rotate(50,60);	gr->Box();
	mglData yc(30), xc(30), z(30);	z.Modify("2*x-1");
	yc.Modify("sin(pi*(2*x-1))");	xc.Modify("cos(pi*2*x-pi)");
	gr->Bars(xc,yc,z,"r");
	gr->SetRanges(-1,1,-3,3);	// increase range since summation can exceed [-1,1]
	gr->SubPlot(3,2,2,"");	gr->Title("'a' style");	gr->Box();	gr->Bars(ys,"a");
	gr->SubPlot(3,2,3,"");	gr->Title("'f' style");	gr->Box();	gr->Bars(ys,"f");
}
