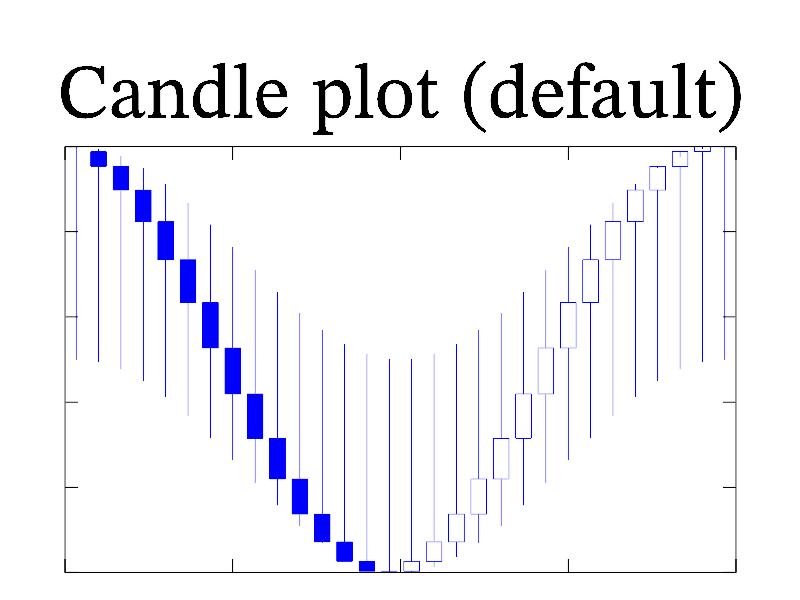
11.18 Sample ‘candle’ 
Function candle draw candlestick chart. This is a combination of a line-chart and a bar-chart, in that each bar represents the range of price movement over a given time interval.
MGL code:
new y 30 'sin(pi*x/2)^2'
subplot 1 1 0 '':title 'Candle plot (default)'
yrange 0 1:box
candle y y/2 (y+1)/2
C++ code:
void smgl_candle(mglGraph *gr)
{
	mglData y(30);	gr->Fill(y,"sin(pi*x/2)^2");
	mglData y1(30);	gr->Fill(y1,"v/2",y);
	mglData y2(30);	gr->Fill(y2,"(1+v)/2",y);
	if(big!=3)	{	gr->SubPlot(1,1,0,"");	gr->Title("Candle plot (default)");	}
	gr->SetRange('y',0,1);	gr->Box();	gr->Candle(y,y1,y2);
}