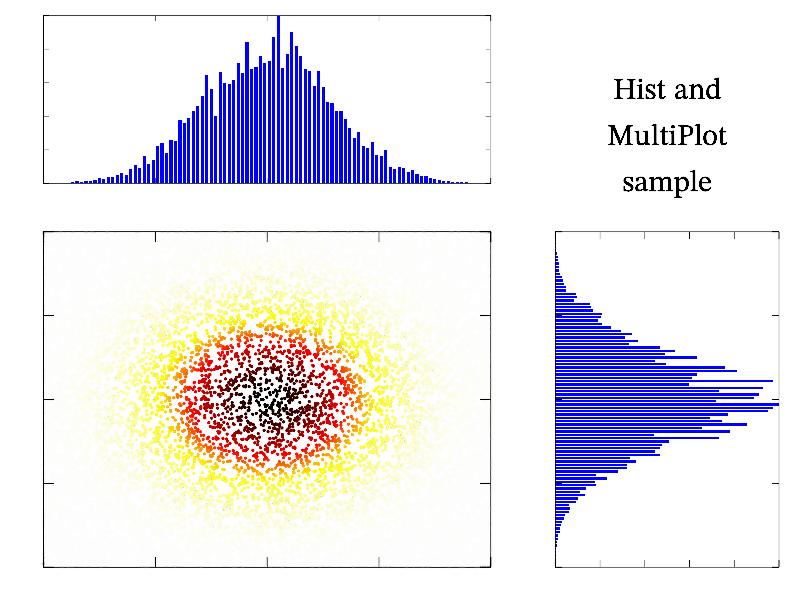
11.63 Sample ‘hist’ 
Example of hist (histogram).
MGL code:
new x 10000 '2*rnd-1':new y 10000 '2*rnd-1':copy z exp(-6*(x^2+y^2))
hist xx x z:norm xx 0 1:hist yy y z:norm yy 0 1
multiplot 3 3 3 2 2 '':ranges -1 1 -1 1 0 1:box:dots x y z 'wyrRk'
multiplot 3 3 0 2 1 '':ranges -1 1 0 1:box:bars xx
multiplot 3 3 5 1 2 '':ranges 0 1 -1 1:box:barh yy
subplot 3 3 2:text 0.5 0.5 'Hist and\n{}MultiPlot\n{}sample' 'a' -3
C++ code:
void smgl_histl(mglGraph *gr)
{
	mglData x(10), w(10), h1, h2;
	x.Modify("(i+rnd)/10");	w.Modify("rnd");
	h1 = x.Hist(w,20,0,1);
	h2 = x.HistL(w,20,0,1);
	gr->SetRanges(0,1,0,1>h1.Maximal()?1:h1.Maximal());

	gr->SubPlot(2,1,0,"<_");	gr->Title("Hist");	gr->Axis();	gr->Box();
	gr->Bars(h1,"b");	gr->Plot(x,w,"2ko");	gr->Stem(x,w,"k");
	gr->SubPlot(2,1,1,"<_");	gr->Title("HistL");	gr->Axis();	gr->Box();
	gr->Bars(h2,"r");	gr->Plot(x,w,"2ko");	gr->Stem(x,w,"k");
}