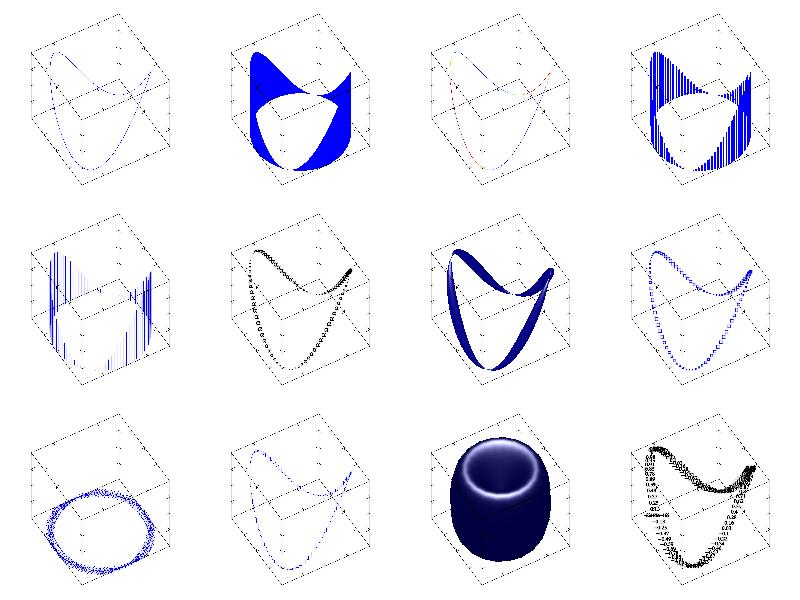
11.88 Sample ‘param1’ 
Example of parametric plots for 1D data.
MGL code:
new x 100 'sin(pi*x)'
new y 100 'cos(pi*x)'
new z 100 'sin(2*pi*x)'
new c 100 'cos(2*pi*x)'

subplot 4 3 0:rotate 40 60:box:plot x y z
subplot 4 3 1:rotate 40 60:box:area x y z
subplot 4 3 2:rotate 40 60:box:tens x y z c
subplot 4 3 3:rotate 40 60:box:bars x y z
subplot 4 3 4:rotate 40 60:box:stem x y z
subplot 4 3 5:rotate 40 60:box:textmark x y z c*2 '\alpha'
subplot 4 3 6:rotate 40 60:box:tube x y z c/10
subplot 4 3 7:rotate 40 60:box:mark x y z c 's'
subplot 4 3 8:box:error x y z/10 c/10
subplot 4 3 9:rotate 40 60:box:step x y z
subplot 4 3 10:rotate 40 60:box:torus x z 'z';light on
subplot 4 3 11:rotate 40 60:box:label x y z '%z'
C++ code:
void smgl_param1(mglGraph *gr)	// 1d parametric plots
{
	mglData x(100), y(100), z(100), c(100);
	gr->Fill(x,"sin(pi*x)");	gr->Fill(y,"cos(pi*x)");
	gr->Fill(z,"sin(2*pi*x)");	gr->Fill(c,"cos(2*pi*x)");

	gr->SubPlot(4,3,0);	gr->Rotate(40,60);	gr->Box();	gr->Plot(x,y,z);
	gr->SubPlot(4,3,1);	gr->Rotate(40,60);	gr->Box();	gr->Area(x,y,z);
	gr->SubPlot(4,3,2);	gr->Rotate(40,60);	gr->Box();	gr->Tens(x,y,z,c);
	gr->SubPlot(4,3,3);	gr->Rotate(40,60);	gr->Box();	gr->Bars(x,y,z);
	gr->SubPlot(4,3,4);	gr->Rotate(40,60);	gr->Box();	gr->Stem(x,y,z);
	gr->SubPlot(4,3,5);	gr->Rotate(40,60);	gr->Box();	gr->TextMark(x,y,z,c*2,"\\alpha");
	gr->SubPlot(4,3,6);	gr->Rotate(40,60);	gr->Box();	gr->Tube(x,y,z,c/10,"","light on");
	gr->SubPlot(4,3,7);	gr->Rotate(40,60);	gr->Box();	gr->Mark(x,y,z,c,"s");
	gr->SubPlot(4,3,8);	gr->Rotate(40,60);	gr->Box();	gr->Error(x,y,z/10,c/10);
	gr->SubPlot(4,3,9);	gr->Rotate(40,60);	gr->Box();	gr->Step(x,y,z);
	gr->SubPlot(4,3,10);gr->Rotate(40,60);	gr->Box();	gr->Torus(x,z,"z","light on");
	gr->SubPlot(4,3,11);gr->Rotate(40,60);	gr->Box();	gr->Label(x,y,z,"%z");
}
