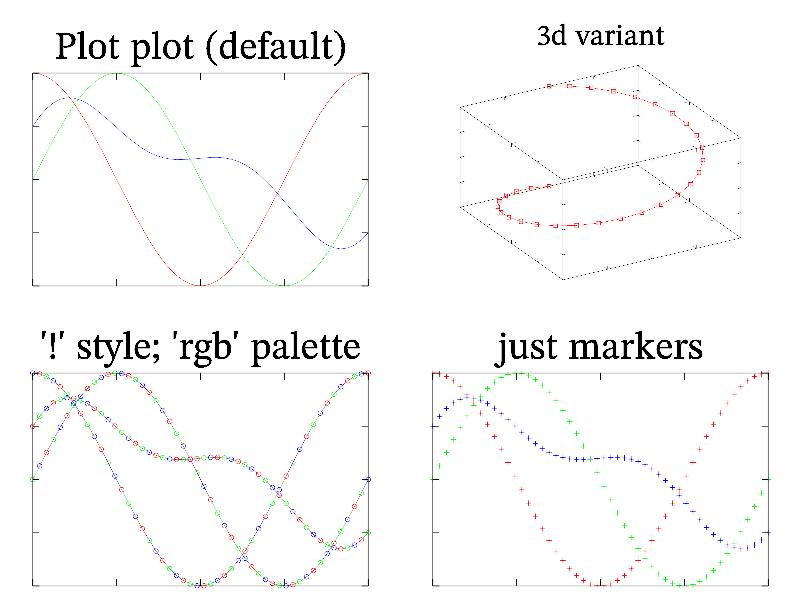
11.96 Sample ‘plot’ 
Function plot is most standard way to visualize 1D data array. By default, Plot use colors from palette. However, you can specify manual color/palette, and even set to use new color for each points by using ‘!’ style. Another feature is ‘ ’ style which draw only markers without line between points.
MGL code:
call 'prepare1d'
subplot 2 2 0 '':title 'Plot plot (default)':box:plot y
subplot 2 2 2 '':title ''!' style; 'rgb' palette':box:plot y 'o!rgb'
subplot 2 2 3 '':title 'just markers':box:plot y ' +'
new yc 30 'sin(pi*x)':new xc 30 'cos(pi*x)':new z 30 'x'
subplot 2 2 1:title '3d variant':rotate 50 60:box:plot xc yc z 'rs'
C++ code:
void smgl_plot(mglGraph *gr)
{
	mglData y;	mgls_prepare1d(&y);	gr->SetOrigin(0,0,0);
	if(big!=3)	{	gr->SubPlot(2,2,0,"");	gr->Title("Plot plot (default)");	}
	gr->Box();	gr->Plot(y);
	if(big==3)	return;
	gr->SubPlot(2,2,2,"");	gr->Title("'!' style; 'rgb' palette");	gr->Box();	gr->Plot(y,"o!rgb");
	gr->SubPlot(2,2,3,"");	gr->Title("just markers");	gr->Box();	gr->Plot(y," +");
	gr->SubPlot(2,2,1);	gr->Title("3d variant");	gr->Rotate(50,60);	gr->Box();
	mglData yc(30), xc(30), z(30);	z.Modify("2*x-1");
	yc.Modify("sin(pi*(2*x-1))");	xc.Modify("cos(pi*2*x-pi)");
	gr->Plot(xc,yc,z,"rs");
}