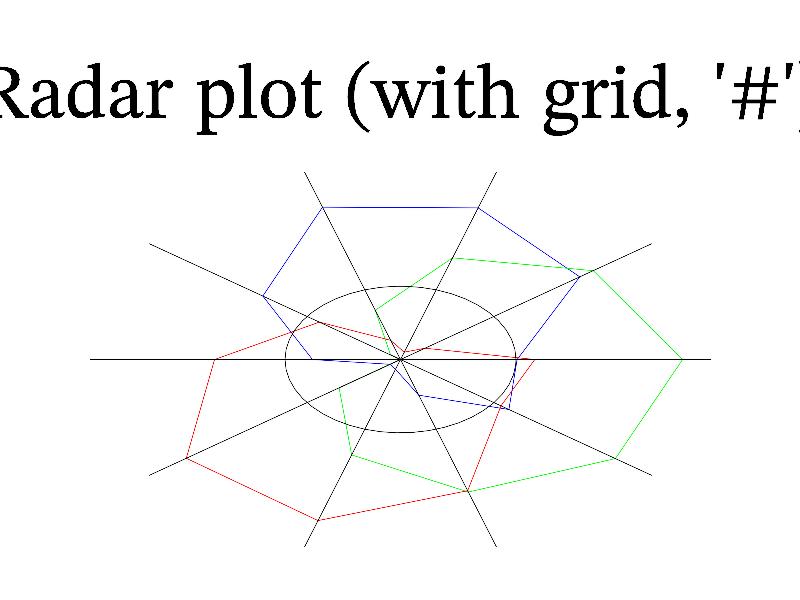
11.110 Sample ‘radar’ 
The radar plot is variant of plot, which make plot in polar coordinates and draw radial rays in point directions. If you just need a plot in polar coordinates then I recommend to use Curvilinear coordinates or plot in parametric form with x=r*cos(fi); y=r*sin(fi);.
MGL code:
new yr 10 3 '0.4*sin(pi*(x+1.5+y/2)+0.1*rnd)'
subplot 1 1 0 '':title 'Radar plot (with grid, "\#")':radar yr '#'
C++ code:
void smgl_radar(mglGraph *gr)
{
	mglData yr(10,3);	yr.Modify("0.4*sin(pi*(2*x+y))+0.1*rnd");
	if(big!=3)	{	gr->SubPlot(1,1,0,"");	gr->Title("Radar plot (with grid, '\\#')");	}
	gr->Radar(yr,"#");
}
