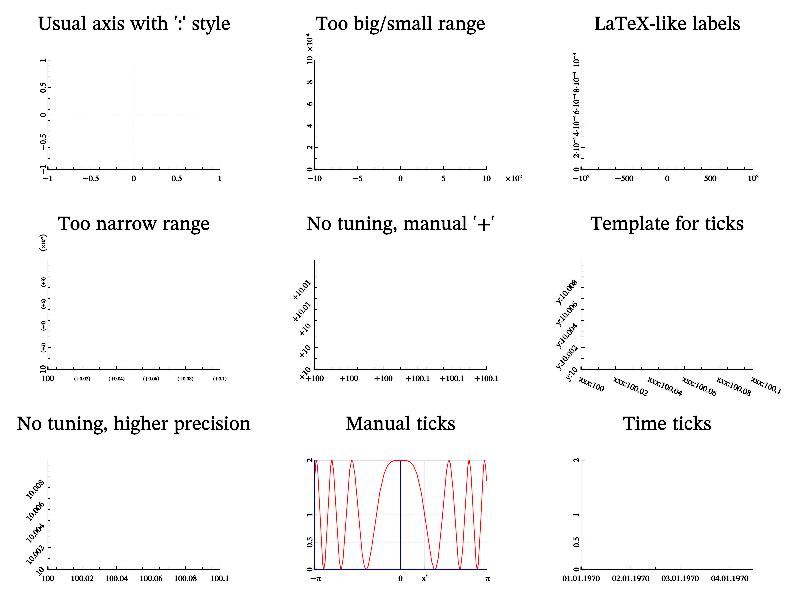
11.138 Sample ‘ticks’ 
Example of axis ticks.
MGL code:
subplot 3 3 0:title 'Usual axis with ":" style'
axis ':'

subplot 3 3 1:title 'Too big/small range'
ranges -1000 1000 0 0.001:axis

subplot 3 3 2:title 'LaTeX-like labels'
axis 'F!'

subplot 3 3 3:title 'Too narrow range'
ranges 100 100.1 10 10.01:axis

subplot 3 3 4:title 'No tuning, manual "+"'
axis '+!'
# for version <2.3 you can use
#tuneticks off:axis

subplot 3 3 5:title 'Template for ticks'
xtick 'xxx:%g':ytick 'y:%g'
axis

xtick '':ytick '' # switch it off for other plots

subplot 3 3 6:title 'No tuning, higher precision'
axis '!4'

subplot 3 3 7:title 'Manual ticks'
ranges -pi pi 0 2
xtick pi 3 '\pi'
xtick 0.886 'x^*' on # note this will disable subticks drawing
# or you can use
#xtick -pi '\pi' -pi/2 '-\pi/2' 0 '0' 0.886 'x^*' pi/2 '\pi/2' pi 'pi'
list v 0 0.5 1 2:ytick v '0
0.5
1
2'
axis:grid:fplot '2*cos(x^2)^2' 'r2'

subplot 3 3 8:title 'Time ticks'
xrange 0 3e5:ticktime 'x':axis
C++ code:
void smgl_ticks(mglGraph *gr)
{
	gr->SubPlot(3,3,0);	gr->Title("Usual axis with ':' style");	gr->Axis(":");
	gr->SubPlot(3,3,1);	gr->Title("Too big/small range");
	gr->SetRanges(-1000,1000,0,0.001);	gr->Axis();
	gr->SubPlot(3,3,2);	gr->Title("LaTeX-like labels");
	gr->Axis("F!");
	gr->SubPlot(3,3,3);	gr->Title("Too narrow range");
	gr->SetRanges(100,100.1,10,10.01);	gr->Axis();
	gr->SubPlot(3,3,4);	gr->Title("No tuning, manual '+'");
	// for version<2.3 you need first call gr->SetTuneTicks(0);
	gr->Axis("+!");
	gr->SubPlot(3,3,5);	gr->Title("Template for ticks");
	gr->SetTickTempl('x',"xxx:%g");	gr->SetTickTempl('y',"y:%g");
	gr->Axis();
	// now switch it off for other plots
	gr->SetTickTempl('x',"");	gr->SetTickTempl('y',"");
	gr->SubPlot(3,3,6);	gr->Title("No tuning, higher precision");
	gr->Axis("!4");
	gr->SubPlot(3,3,7);	gr->Title("Manual ticks");	gr->SetRanges(-M_PI,M_PI, 0, 2);
	gr->SetTicks('x',M_PI,0,0,"\\pi");	gr->AddTick('x',0.886,"x^*");
	// alternatively you can use following lines
	double val[]={0, 0.5, 1, 2};
	gr->SetTicksVal('y', mglData(4,val), "0\n0.5\n1\n2");
	gr->Axis();	gr->Grid();	gr->FPlot("2*cos(x^2)^2", "r2");
	gr->SubPlot(3,3,8);	gr->Title("Time ticks");	gr->SetRange('x',0,3e5);
	gr->SetTicksTime('x',0);	gr->Axis();
}
