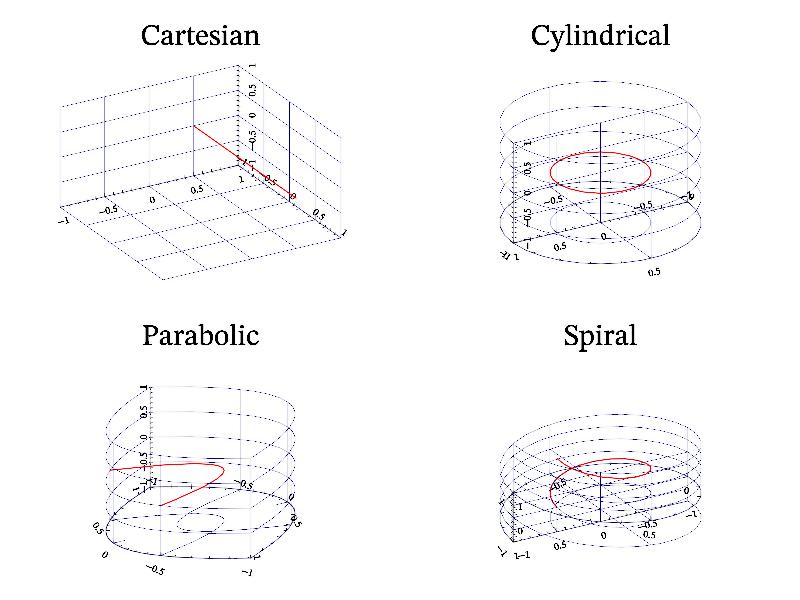
3.2.3 Curvilinear coordinates 
As I noted in previous subsection, MathGL support curvilinear coordinates. In difference from other plotting programs and libraries, MathGL uses textual formulas for connection of the old (data) and new (output) coordinates. This allows one to plot in arbitrary coordinates. The following code plots the line y=0, z=0 in Cartesian, polar, parabolic and spiral coordinates:
int sample(mglGraph *gr)
{
  gr->SetOrigin(-1,1,-1);

  gr->SubPlot(2,2,0); gr->Title("Cartesian"); gr->Rotate(50,60);
  gr->FPlot("2*t-1","0.5","0","r2");
  gr->Axis(); gr->Grid();

  gr->SetFunc("y*sin(pi*x)","y*cos(pi*x)",0);
  gr->SubPlot(2,2,1); gr->Title("Cylindrical"); gr->Rotate(50,60);
  gr->FPlot("2*t-1","0.5","0","r2");
  gr->Axis(); gr->Grid();

  gr->SetFunc("2*y*x","y*y - x*x",0);
  gr->SubPlot(2,2,2); gr->Title("Parabolic"); gr->Rotate(50,60);
  gr->FPlot("2*t-1","0.5","0","r2");
  gr->Axis(); gr->Grid();

  gr->SetFunc("y*sin(pi*x)","y*cos(pi*x)","x+z");
  gr->SubPlot(2,2,3); gr->Title("Spiral");  gr->Rotate(50,60);
  gr->FPlot("2*t-1","0.5","0","r2");
  gr->Axis(); gr->Grid();
  gr->SetFunc(0,0,0); // set to default Cartesian
  return 0;
}
