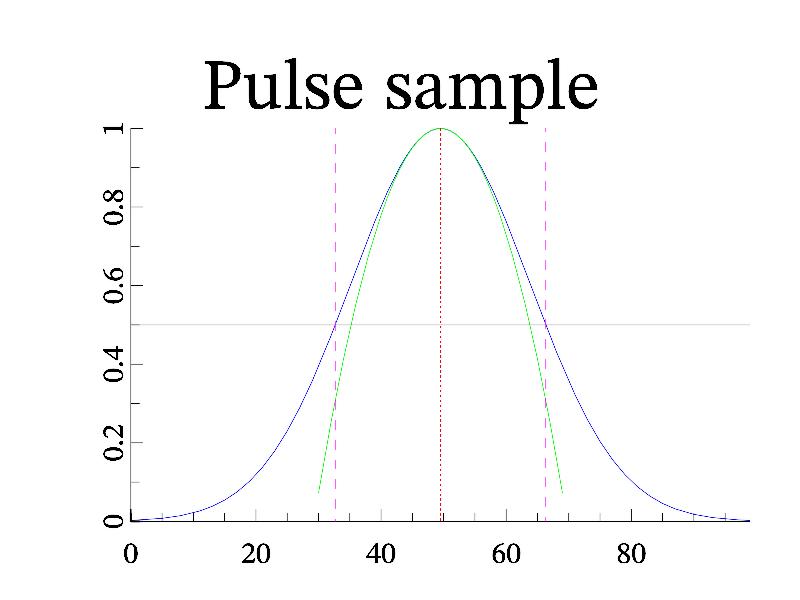
3.5.16 Pulse properties 
There is common task in optics to determine properties of wave pulses or wave beams. MathGL provide special function pulse which return the pulse properties (maximal value, center of mass, width and so on). Its usage is rather simple. Here I just illustrate it on the example of Gaussian pulse, where all parameters are obvious.
void sample(mglGraph *gr)
{
  gr->SubPlot(1,1,0,"<_");  gr->Title("Pulse sample");
  // first prepare pulse itself
  mglData a(100); gr->Fill(a,"exp(-6*x^2)");
  // get pulse parameters
  mglData b(a.Pulse('x'));
  // positions and widths are normalized on the number of points. So, set proper axis scale.
  gr->SetRanges(0, a.nx-1, 0, 1);
  gr->Axis(); gr->Plot(a);  // draw pulse and axis
  // now visualize found pulse properties
  double m = b[0];  // maximal amplitude
  // approximate position of maximum
  gr->Line(mglPoint(b[1],0), mglPoint(b[1],m),"r=");
  // width at half-maximum (so called FWHM)
  gr->Line(mglPoint(b[1]-b[3]/2,0), mglPoint(b[1]-b[3]/2,m),"m|");
  gr->Line(mglPoint(b[1]+b[3]/2,0), mglPoint(b[1]+b[3]/2,m),"m|");
  gr->Line(mglPoint(0,m/2), mglPoint(a.nx-1,m/2),"h");
  // parabolic approximation near maximum
  char func[128];	sprintf(func,"%g*(1-((x-%g)/%g)^2)",b[0],b[1],b[2]);
  gr->FPlot(func,"g");
}
