3.2.1 Subplots 
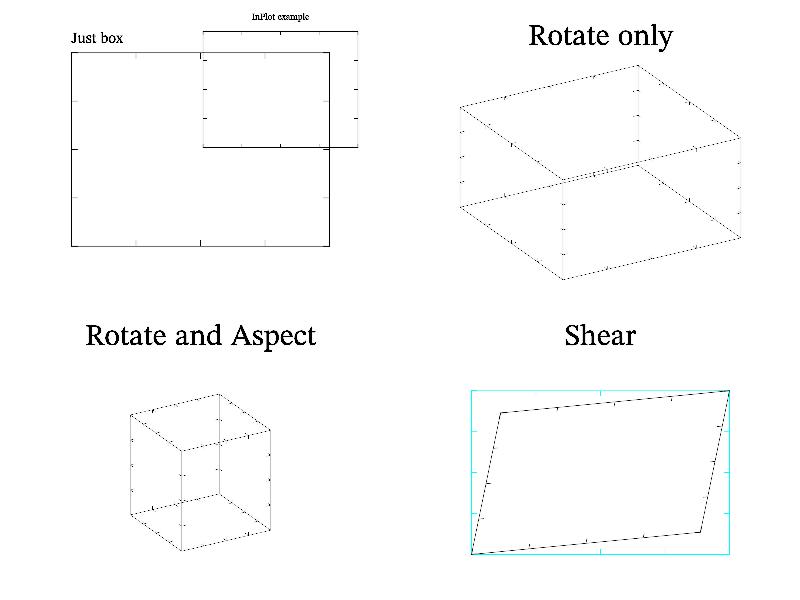
Let me demonstrate possibilities of plot positioning and rotation. MathGL has a set of functions: subplot, inplot, title, aspect and rotate and so on (see Матрица преобразования). The order of their calling is strictly determined. First, one changes the position of plot in image area (functions subplot, inplot and multiplot). Secondly, you can add the title of plot by title function. After that one may rotate the plot (function rotate). Finally, one may change aspects of axes (function aspect). The following code illustrates the aforesaid it:
int sample(mglGraph *gr)
{
  gr->SubPlot(2,2,0); gr->Box();
  gr->Puts(mglPoint(-1,1.1),"Just box",":L");
  gr->InPlot(0.2,0.5,0.7,1,false);  gr->Box();
  gr->Puts(mglPoint(0,1.2),"InPlot example");
  gr->SubPlot(2,2,1); gr->Title("Rotate only");
  gr->Rotate(50,60);  gr->Box();
  gr->SubPlot(2,2,2); gr->Title("Rotate and Aspect");
  gr->Rotate(50,60);  gr->Aspect(1,1,2);  gr->Box();
  gr->SubPlot(2,2,3); gr->Title("Shear");
  gr->Box("c"); gr->Shear(0.2,0.1); gr->Box();
  return 0;
}
Here I used function Puts for printing the text in arbitrary position of picture (see Вывод текста). Text coordinates and size are connected with axes. However, text coordinates may be everywhere, including the outside the bounding box. I’ll show its features later in Text features.
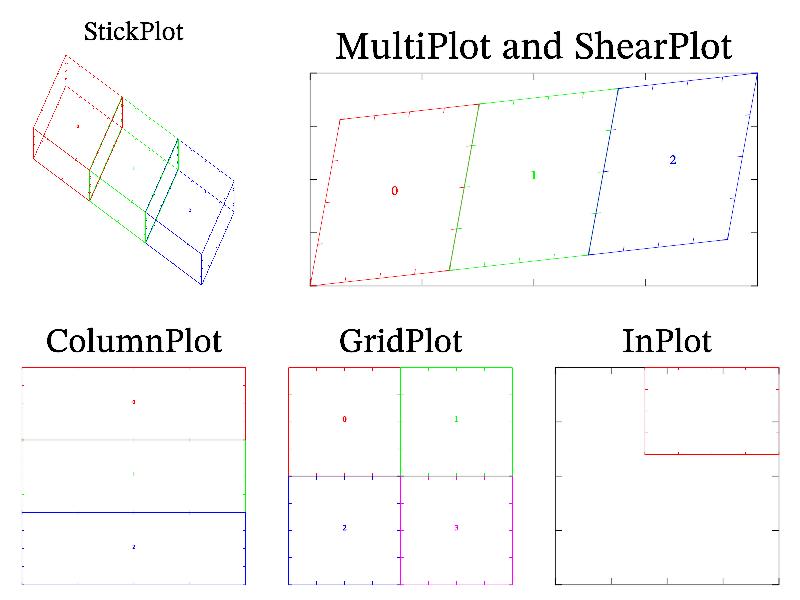
More complicated sample show how to use most of positioning functions:
int sample(mglGraph *gr)
{
  gr->SubPlot(3,2,0); gr->Title("StickPlot");
  gr->StickPlot(3, 0, 20, 30);  gr->Box("r"); gr->Puts(mglPoint(0),"0","r");
  gr->StickPlot(3, 1, 20, 30);  gr->Box("g"); gr->Puts(mglPoint(0),"1","g");
  gr->StickPlot(3, 2, 20, 30);  gr->Box("b"); gr->Puts(mglPoint(0),"2","b");
  gr->SubPlot(3,2,3,"");  gr->Title("ColumnPlot");
  gr->ColumnPlot(3, 0); gr->Box("r"); gr->Puts(mglPoint(0),"0","r");
  gr->ColumnPlot(3, 1); gr->Box("g"); gr->Puts(mglPoint(0),"1","g");
  gr->ColumnPlot(3, 2); gr->Box("b"); gr->Puts(mglPoint(0),"2","b");
  gr->SubPlot(3,2,4,"");  gr->Title("GridPlot");
  gr->GridPlot(2, 2, 0);  gr->Box("r"); gr->Puts(mglPoint(0),"0","r");
  gr->GridPlot(2, 2, 1);  gr->Box("g"); gr->Puts(mglPoint(0),"1","g");
  gr->GridPlot(2, 2, 2);  gr->Box("b"); gr->Puts(mglPoint(0),"2","b");
  gr->GridPlot(2, 2, 3);  gr->Box("m"); gr->Puts(mglPoint(0),"3","m");
  gr->SubPlot(3,2,5,"");  gr->Title("InPlot");  gr->Box();
  gr->InPlot(0.4, 1, 0.6, 1, true); gr->Box("r");
  gr->MultiPlot(3,2,1, 2, 1,"");  gr->Title("MultiPlot and ShearPlot"); gr->Box();
  gr->ShearPlot(3, 0, 0.2, 0.1);  gr->Box("r"); gr->Puts(mglPoint(0),"0","r");
  gr->ShearPlot(3, 1, 0.2, 0.1);  gr->Box("g"); gr->Puts(mglPoint(0),"1","g");
  gr->ShearPlot(3, 2, 0.2, 0.1);  gr->Box("b"); gr->Puts(mglPoint(0),"2","b");
  return 0;
}

