3.5.7 Using primitives 
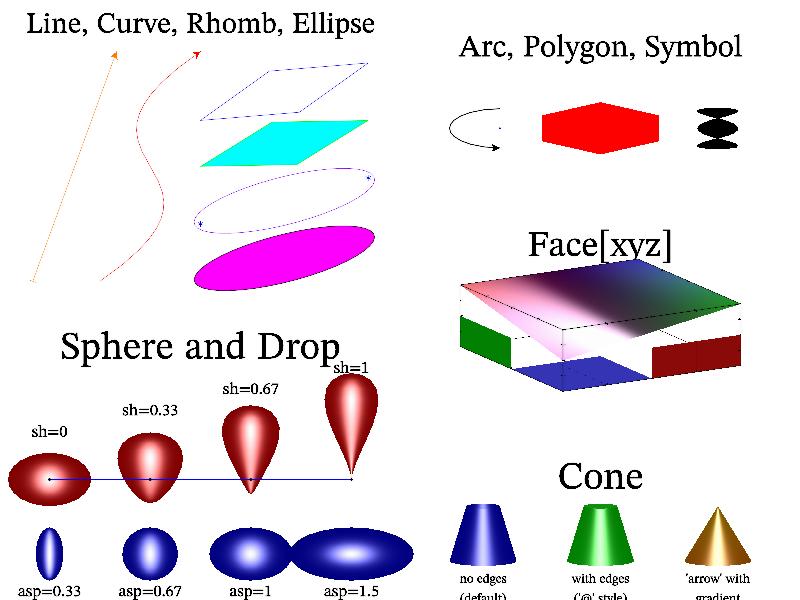
MathGL provide a set of functions for drawing primitives (see Рисование примитивов). Primitives are low level object, which used by most of plotting functions. Picture below demonstrate some of commonly used primitives.
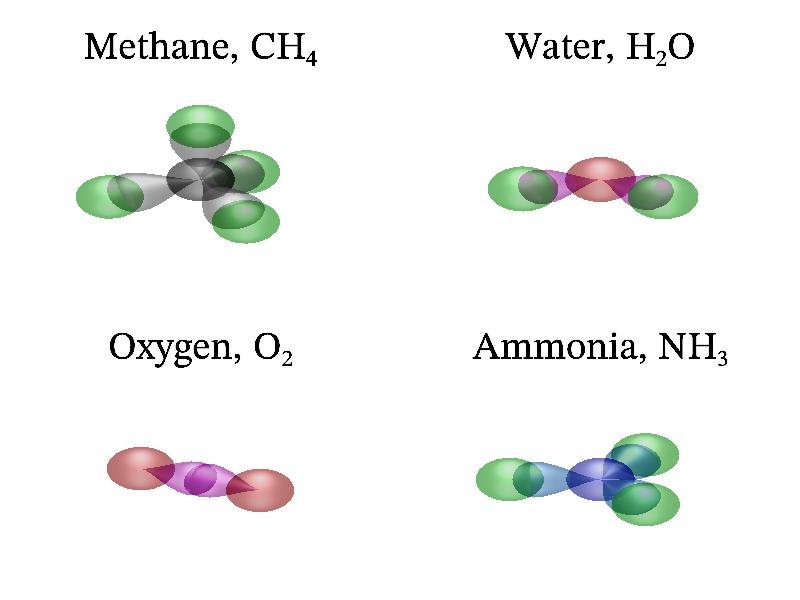
Generally, you can create arbitrary new kind of plot using primitives. For example, MathGL don’t provide any special functions for drawing molecules. However, you can do it using only one type of primitives drop. The sample code is:
int sample(mglGraph *gr)
{
  gr->Alpha(true);  gr->Light(true);

  gr->SubPlot(2,2,0,"");  gr->Title("Methane, CH_4");
  gr->StartGroup("Methane");
  gr->Rotate(60,120);
  gr->Sphere(mglPoint(0,0,0),0.25,"k");
  gr->Drop(mglPoint(0,0,0),mglPoint(0,0,1),0.35,"h",1,2);
  gr->Sphere(mglPoint(0,0,0.7),0.25,"g");
  gr->Drop(mglPoint(0,0,0),mglPoint(-0.94,0,-0.33),0.35,"h",1,2);
  gr->Sphere(mglPoint(-0.66,0,-0.23),0.25,"g");
  gr->Drop(mglPoint(0,0,0),mglPoint(0.47,0.82,-0.33),0.35,"h",1,2);
  gr->Sphere(mglPoint(0.33,0.57,-0.23),0.25,"g");
  gr->Drop(mglPoint(0,0,0),mglPoint(0.47,-0.82,-0.33),0.35,"h",1,2);
  gr->Sphere(mglPoint(0.33,-0.57,-0.23),0.25,"g");
  gr->EndGroup();

  gr->SubPlot(2,2,1,"");  gr->Title("Water, H_{2}O");
  gr->StartGroup("Water");
  gr->Rotate(60,100);
  gr->StartGroup("Water_O");
  gr->Sphere(mglPoint(0,0,0),0.25,"r");
  gr->EndGroup();
  gr->StartGroup("Water_Bond_1");
  gr->Drop(mglPoint(0,0,0),mglPoint(0.3,0.5,0),0.3,"m",1,2);
  gr->EndGroup();
  gr->StartGroup("Water_H_1");
  gr->Sphere(mglPoint(0.3,0.5,0),0.25,"g");
  gr->EndGroup();
  gr->StartGroup("Water_Bond_2");
  gr->Drop(mglPoint(0,0,0),mglPoint(0.3,-0.5,0),0.3,"m",1,2);
  gr->EndGroup();
  gr->StartGroup("Water_H_2");
  gr->Sphere(mglPoint(0.3,-0.5,0),0.25,"g");
  gr->EndGroup();
  gr->EndGroup();

  gr->SubPlot(2,2,2,"");  gr->Title("Oxygen, O_2");
  gr->StartGroup("Oxygen");
  gr->Rotate(60,120);
  gr->Drop(mglPoint(0,0.5,0),mglPoint(0,-0.3,0),0.3,"m",1,2);
  gr->Sphere(mglPoint(0,0.5,0),0.25,"r");
  gr->Drop(mglPoint(0,-0.5,0),mglPoint(0,0.3,0),0.3,"m",1,2);
  gr->Sphere(mglPoint(0,-0.5,0),0.25,"r");
  gr->EndGroup();

  gr->SubPlot(2,2,3,"");  gr->Title("Ammonia, NH_3");
  gr->StartGroup("Ammonia");
  gr->Rotate(60,120);
  gr->Sphere(mglPoint(0,0,0),0.25,"b");
  gr->Drop(mglPoint(0,0,0),mglPoint(0.33,0.57,0),0.32,"n",1,2);
  gr->Sphere(mglPoint(0.33,0.57,0),0.25,"g");
  gr->Drop(mglPoint(0,0,0),mglPoint(0.33,-0.57,0),0.32,"n",1,2);
  gr->Sphere(mglPoint(0.33,-0.57,0),0.25,"g");
  gr->Drop(mglPoint(0,0,0),mglPoint(-0.65,0,0),0.32,"n",1,2);
  gr->Sphere(mglPoint(-0.65,0,0),0.25,"g");
  gr->EndGroup();
  return 0;
}
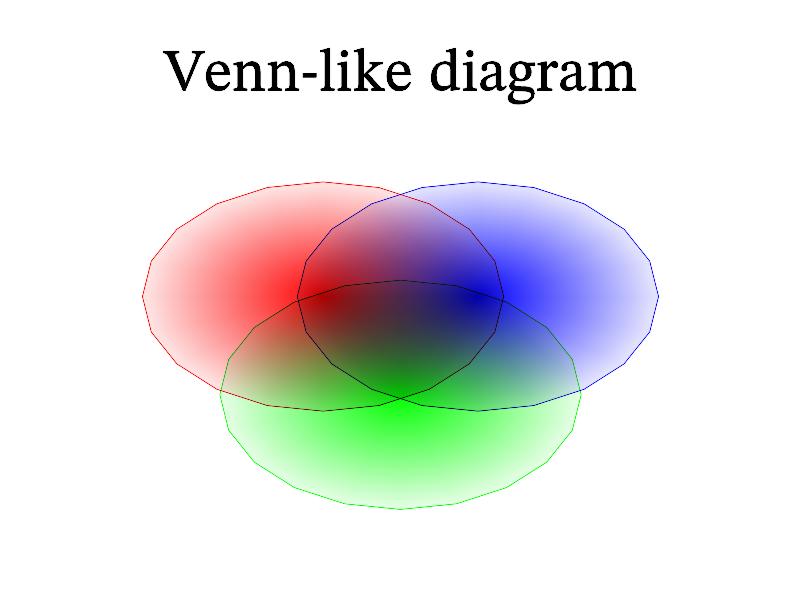
Moreover, some of special plots can be more easily produced by primitives rather than by specialized function. For example, Venn diagram can be produced by Error plot:
int sample(mglGraph *gr)
{
  double xx[3]={-0.3,0,0.3}, yy[3]={0.3,-0.3,0.3}, ee[3]={0.7,0.7,0.7};
  mglData x(3,xx), y(3,yy), e(3,ee);
  gr->Title("Venn-like diagram"); gr->Alpha(true);
  gr->Error(x,y,e,e,"!rgb@#o");
  return 0;
}
You see that you have to specify and fill 3 data arrays. The same picture can be produced by just 3 calls of circle function:
int sample(mglGraph *gr)
{
  gr->Title("Venn-like diagram"); gr->Alpha(true);
  gr->Circle(mglPoint(-0.3,0.3),0.7,"rr@");
  gr->Circle(mglPoint(0,-0.3),0.7,"gg@");
  gr->Circle(mglPoint( 0.3,0.3),0.7,"bb@");
  return 0;
}
Of course, the first variant is more suitable if you need to plot a lot of circles. But for few ones the usage of primitives looks easy.