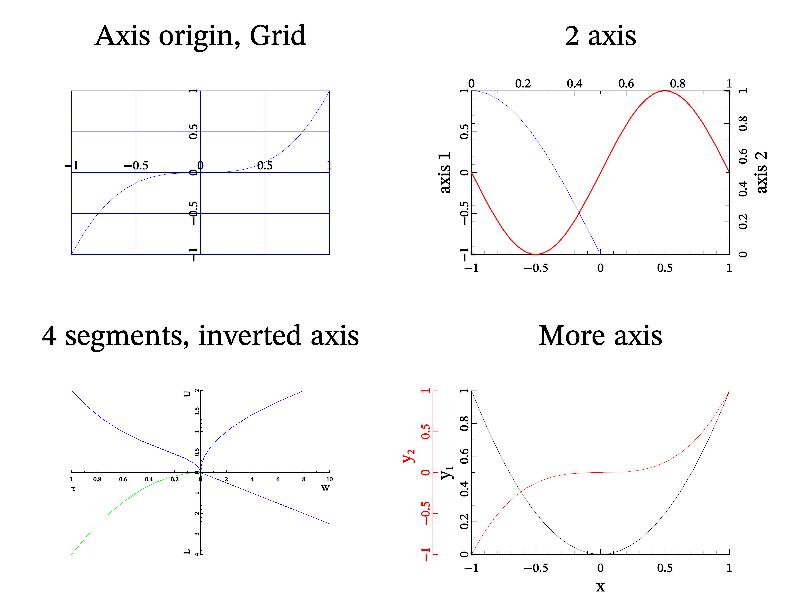
11.8 Sample ‘axis’ 
Different forms of axis position.
MGL code:
subplot 2 2 0:title 'Axis origin, Grid':origin 0 0:axis:grid:fplot 'x^3'
subplot 2 2 1:title '2 axis':ranges -1 1 -1 1:origin -1 -1:axis:ylabel 'axis_1':fplot 'sin(pi*x)' 'r2'
ranges 0 1 0 1:origin 1 1:axis:ylabel 'axis_2':fplot 'cos(pi*x)'
subplot 2 2 3:title 'More axis':origin nan nan:xrange -1 1:axis:xlabel 'x' 0:ylabel 'y_1' 0:fplot 'x^2' 'k'
yrange -1 1:origin -1.3 -1:axis 'y' 'r':ylabel '#r{y_2}' 0.2:fplot 'x^3' 'r'

subplot 2 2 2:title '4 segments, inverted axis':origin 0 0:
inplot 0.5 1 0.5 1 on:ranges 0 10 0 2:axis
fplot 'sqrt(x/2)':xlabel 'W' 1:ylabel 'U' 1
inplot 0 0.5 0.5 1 on:ranges 1 0 0 2:axis 'x':fplot 'sqrt(x)+x^3':xlabel '\tau' 1
inplot 0.5 1 0 0.5 on:ranges 0 10 4 0:axis 'y':fplot 'x/4':ylabel 'L' -1
inplot 0 0.5 0 0.5 on:ranges 1 0 4 0:fplot '4*x^2'
C++ code:
void smgl_axis(mglGraph *gr)
{
	gr->SubPlot(2,2,0);	gr->Title("Axis origin, Grid");	gr->SetOrigin(0,0);
	gr->Axis();	gr->Grid();	gr->FPlot("x^3");

	gr->SubPlot(2,2,1);	gr->Title("2 axis");
	gr->SetRanges(-1,1,-1,1);	gr->SetOrigin(-1,-1,-1);	// first axis
	gr->Axis();	gr->Label('y',"axis 1",0);	gr->FPlot("sin(pi*x)","r2");
	gr->SetRanges(0,1,0,1);		gr->SetOrigin(1,1,1);		// second axis
	gr->Axis();	gr->Label('y',"axis 2",0);	gr->FPlot("cos(pi*x)");

	gr->SubPlot(2,2,3);	gr->Title("More axis");	gr->SetOrigin(NAN,NAN);	gr->SetRange('x',-1,1);
	gr->Axis();	gr->Label('x',"x",0);	gr->Label('y',"y_1",0);	gr->FPlot("x^2","k");
	gr->SetRanges(-1,1,-1,1);	gr->SetOrigin(-1.3,-1);	// second axis
	gr->Axis("y","r");	gr->Label('y',"#r{y_2}",0.2);	gr->FPlot("x^3","r");

	gr->SubPlot(2,2,2);	gr->Title("4 segments, inverted axis");		gr->SetOrigin(0,0);
	gr->InPlot(0.5,1,0.5,1);	gr->SetRanges(0,10,0,2);	gr->Axis();
	gr->FPlot("sqrt(x/2)");		gr->Label('x',"W",1);	gr->Label('y',"U",1);
	gr->InPlot(0,0.5,0.5,1);	gr->SetRanges(1,0,0,2);	gr->Axis("x");
	gr->FPlot("sqrt(x)+x^3");	gr->Label('x',"\\tau",-1);
	gr->InPlot(0.5,1,0,0.5);	gr->SetRanges(0,10,4,0);	gr->Axis("y");
	gr->FPlot("x/4");	gr->Label('y',"L",-1);
	gr->InPlot(0,0.5,0,0.5);	gr->SetRanges(1,0,4,0);	gr->FPlot("4*x^2");
}
