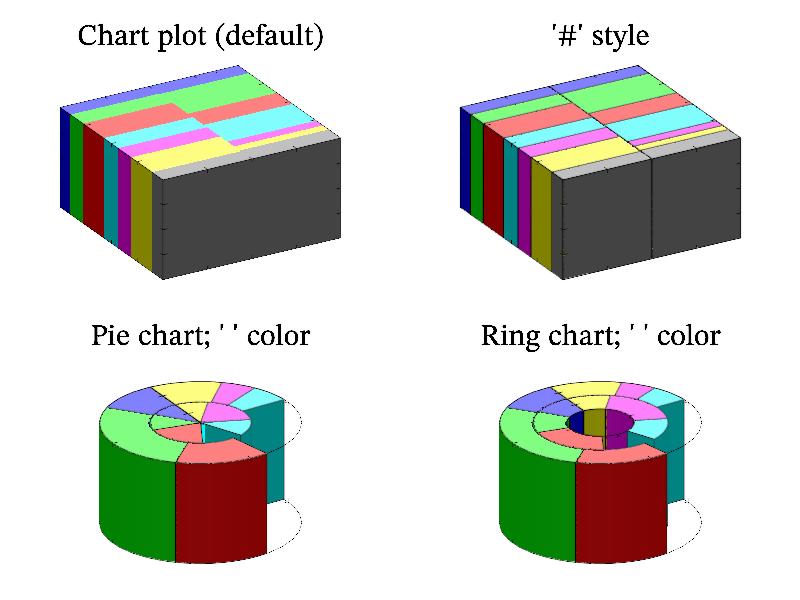
11.19 Sample ‘chart’ 
Function chart draw colored boxes with width proportional to data values. Use ‘ ’ for empty box. It produce well known pie chart if drawn in polar coordinates.
MGL code:
new ch 7 2 'rnd+0.1':light on
subplot 2 2 0:title 'Chart plot (default)':rotate 50 60:box:chart ch
subplot 2 2 1:title '"\#" style':rotate 50 60:box:chart ch '#'
subplot 2 2 2:title 'Pie chart; " " color':rotate 50 60:
axis '(y+1)/2*cos(pi*x)' '(y+1)/2*sin(pi*x)' '':box:chart ch 'bgr cmy#'
subplot 2 2 3:title 'Ring chart; " " color':rotate 50 60:
axis '(y+2)/3*cos(pi*x)' '(y+2)/3*sin(pi*x)' '':box:chart ch 'bgr cmy#'
C++ code:
void smgl_chart(mglGraph *gr)
{
	mglData ch(7,2);	for(int i=0;i<7*2;i++)	ch.a[i]=mgl_rnd()+0.1;
	if(big!=3)	{	gr->SubPlot(2,2,0);	gr->Title("Chart plot (default)");	}
	gr->Light(true);	gr->Rotate(50,60);	gr->Box();	gr->Chart(ch);
	if(big==3)	return;
	gr->SubPlot(2,2,1);	gr->Title("'\\#' style");
	gr->Rotate(50,60);	gr->Box();	gr->Chart(ch,"#");
	gr->SubPlot(2,2,2);	gr->Title("Pie chart; ' ' color");
	gr->SetFunc("(y+1)/2*cos(pi*x)","(y+1)/2*sin(pi*x)","");
	gr->Rotate(50,60);	gr->Box();	gr->Chart(ch,"bgr cmy#");
	gr->SubPlot(2,2,3);	gr->Title("Ring chart; ' ' color");
	gr->SetFunc("(y+2)/3*cos(pi*x)","(y+2)/3*sin(pi*x)","");
	gr->Rotate(50,60);	gr->Box();	gr->Chart(ch,"bgr cmy#");
}