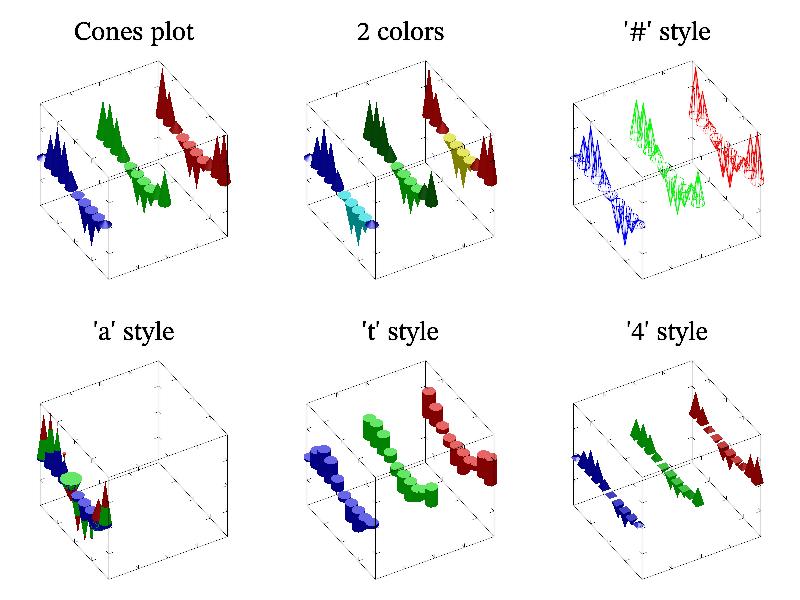
11.23 Sample ‘cones’ 
Function cones is similar to bars but draw cones.
MGL code:
new ys 10 3 '0.8*sin(pi*(x+y/4+1.25))+0.2*rnd'
light on:origin 0 0 0
subplot 3 2 0:title 'Cones plot':rotate 50 60:box:cones ys
subplot 3 2 1:title '2 colors':rotate 50 60:box:cones ys 'cbgGyr'
subplot 3 2 2:title '"\#" style':rotate 50 60:box:cones ys '#'
subplot 3 2 3:title '"a" style':rotate 50 60:zrange -2 2:box:cones ys 'a'
subplot 3 2 4:title '"t" style':rotate 50 60:box:cones ys 't'
subplot 3 2 5:title '"4" style':rotate 50 60:box:cones ys '4'
C++ code:
void smgl_cones(mglGraph *gr)
{
	mglData ys(10,3);	ys.Modify("0.8*sin(pi*(2*x+y/2))+0.2*rnd");
	gr->Light(true);	gr->SetOrigin(0,0,0);
	if(big!=3)	{	gr->SubPlot(3,2,0);	gr->Title("Cones plot");	}
	gr->Rotate(50,60);	gr->Box();	gr->Cones(ys);
	if(big==3)	return;
	gr->SubPlot(3,2,1);	gr->Title("2 colors");
	gr->Rotate(50,60);	gr->Box();	gr->Cones(ys,"cbgGyr");
	gr->SubPlot(3,2,2);	gr->Title("'\\#' style");
	gr->Rotate(50,60);	gr->Box();	gr->Cones(ys,"#");
	gr->SubPlot(3,2,3);	gr->Title("'a' style");
	gr->SetRange('z',-2,2);	// increase range since summation can exceed [-1,1]
	gr->Rotate(50,60);	gr->Box();	gr->Cones(ys,"a");
	gr->SubPlot(3,2,4);	gr->Title("'t' style");
	gr->Rotate(50,60);	gr->Box();	gr->Cones(ys,"t");
	gr->SubPlot(3,2,5);	gr->Title("'4' style");
	gr->Rotate(50,60);	gr->Box();	gr->Cones(ys,"4");
}