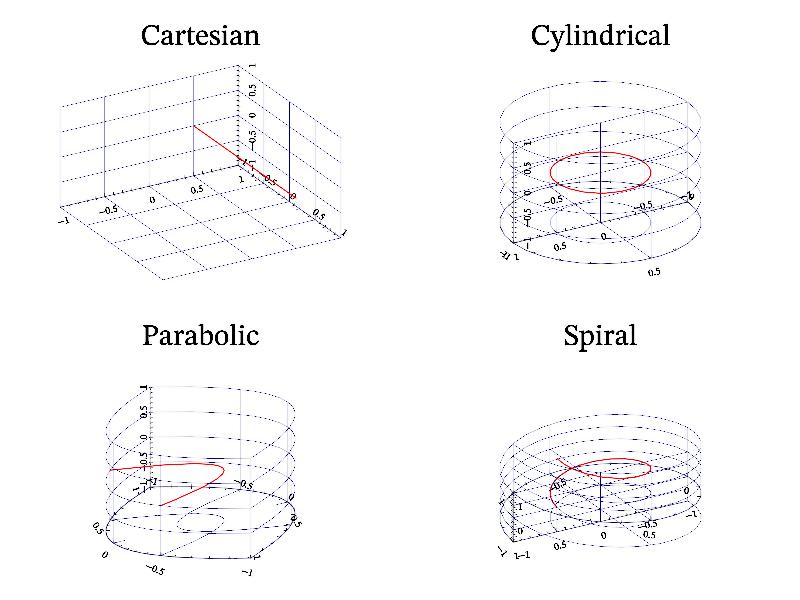
11.34 Sample ‘curvcoor’ 
Some common curvilinear coordinates.
MGL code:
origin -1 1 -1
subplot 2 2 0:title 'Cartesian':rotate 50 60:fplot '2*t-1' '0.5' '0' '2r':axis:grid
axis 'y*sin(pi*x)' 'y*cos(pi*x)' '':subplot 2 2 1:title 'Cylindrical':rotate 50 60:fplot '2*t-1' '0.5' '0' '2r':axis:grid
axis '2*y*x' 'y*y - x*x' '':subplot 2 2 2:title 'Parabolic':rotate 50 60:fplot '2*t-1' '0.5' '0' '2r':axis:grid
axis 'y*sin(pi*x)' 'y*cos(pi*x)' 'x+z':subplot 2 2 3:title 'Spiral':rotate 50 60:fplot '2*t-1' '0.5' '0' '2r':axis:grid
C++ code:
void smgl_curvcoor(mglGraph *gr)	// curvilinear coordinates
{
	gr->SetOrigin(-1,1,-1);

	gr->SubPlot(2,2,0);	gr->Title("Cartesian");	gr->Rotate(50,60);
	gr->FPlot("2*t-1","0.5","0","r2");
	gr->Axis(); gr->Grid();

	gr->SetFunc("y*sin(pi*x)","y*cos(pi*x)",0);
	gr->SubPlot(2,2,1);	gr->Title("Cylindrical");	gr->Rotate(50,60);
	gr->FPlot("2*t-1","0.5","0","r2");
	gr->Axis(); gr->Grid();

	gr->SetFunc("2*y*x","y*y - x*x",0);
	gr->SubPlot(2,2,2);	gr->Title("Parabolic");	gr->Rotate(50,60);
	gr->FPlot("2*t-1","0.5","0","r2");
	gr->Axis(); gr->Grid();

	gr->SetFunc("y*sin(pi*x)","y*cos(pi*x)","x+z");
	gr->SubPlot(2,2,3);	gr->Title("Spiral");	gr->Rotate(50,60);
	gr->FPlot("2*t-1","0.5","0","r2");
	gr->Axis(); gr->Grid();
	gr->SetFunc(0,0,0);	// set to default Cartesian
}