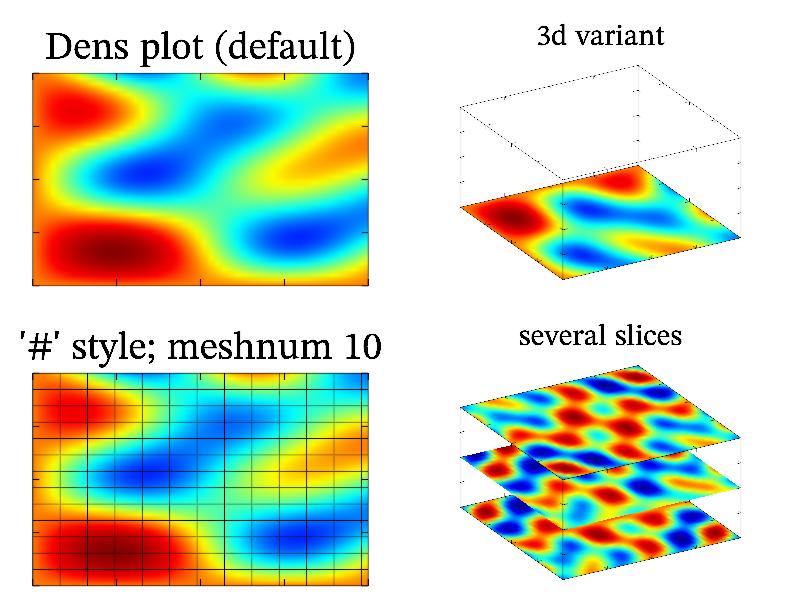
11.42 Sample ‘dens’ 
Function dens draw density plot (also known as color-map) for surface.
MGL code:
call 'prepare2d'
new a1 30 40 3 '0.6*sin(2*pi*x+pi*(z+1)/2)*sin(3*pi*y+pi*z) + 0.4*cos(3*pi*(x*y)+pi*(z+1)^2/2)'
subplot 2 2 0 '':title 'Dens plot (default)':box:dens a
subplot 2 2 1:title '3d variant':rotate 50 60:box:dens a
subplot 2 2 2 '':title '"\#" style; meshnum 10':box:dens a '#'; meshnum 10
subplot 2 2 3:title 'several slices':rotate 50 60:box:dens a1
C++ code:
void smgl_dens3(mglGraph *gr)
{
	mglData c;	mgls_prepare3d(&c);
	if(big!=3)	gr->Title("Dens3 sample");
	gr->Rotate(50,60);	gr->Alpha(true);	gr->SetAlphaDef(0.7);
	gr->SetOrigin(0,0,0);	gr->Axis("_xyz");	gr->Box();
	gr->Dens3(c,"x");	gr->Dens3(c);	gr->Dens3(c,"z");
}
