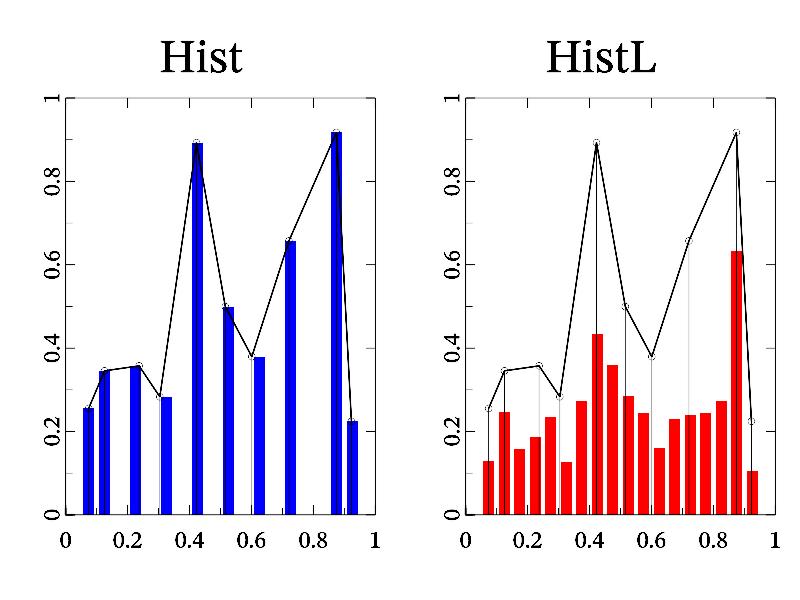
11.64 Sample ‘histl’ 
Example of histl (histogram with linear interpolation).
MGL code:
new x 10 '(i+rnd)/10'
new w 10 'rnd'
ranges 0 1 0 1
hist h1 x w 20 0 1:yrange 0 h1.max on
histl h2 x w 20 0 1
subplot 2 1 0 '<_':title 'Hist':axis:box
bars h1 'b'
plot x w 'k2o':stem x w 'k'
subplot 2 1 1 '<_':title 'HistL':axis:box
bars h2 'r'
plot x w 'k2o':stem x w 'k'
C++ code:
void smgl_histl(mglGraph *gr)
{
	mglData x(10), w(10), h1, h2;
	x.Modify("(i+rnd)/10");	w.Modify("rnd");
	h1 = x.Hist(w,20,0,1);
	h2 = x.HistL(w,20,0,1);
	gr->SetRanges(0,1,0,1>h1.Maximal()?1:h1.Maximal());

	gr->SubPlot(2,1,0,"<_");	gr->Title("Hist");	gr->Axis();	gr->Box();
	gr->Bars(h1,"b");	gr->Plot(x,w,"2ko");	gr->Stem(x,w,"k");
	gr->SubPlot(2,1,1,"<_");	gr->Title("HistL");	gr->Axis();	gr->Box();
	gr->Bars(h2,"r");	gr->Plot(x,w,"2ko");	gr->Stem(x,w,"k");
}