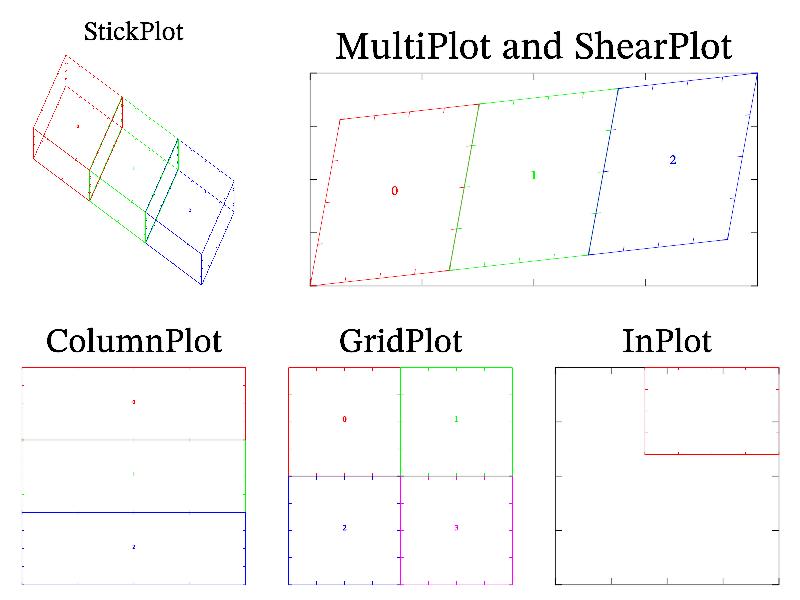
11.69 Sample ‘inplot’ 
Example of inplot, multiplot, columnplot, gridplot, shearplot, stickplot.
MGL code:
subplot 3 2 0:title 'StickPlot'
stickplot 3 0 20 30:box 'r':text 0 0 0 '0' 'r'
stickplot 3 1 20 30:box 'g':text 0 0 0 '1' 'g'
stickplot 3 2 20 30:box 'b':text 0 9 0 '2' 'b'
subplot 3 2 3 '':title 'ColumnPlot'
columnplot 3 0:box 'r':text 0 0 '0' 'r'
columnplot 3 1:box 'g':text 0 0 '1' 'g'
columnplot 3 2:box 'b':text 0 0 '2' 'b'
subplot 3 2 4 '':title 'GridPlot'
gridplot 2 2 0:box 'r':text 0 0 '0' 'r'
gridplot 2 2 1:box 'g':text 0 0 '1' 'g'
gridplot 2 2 2:box 'b':text 0 0 '2' 'b'
gridplot 2 2 3:box 'm':text 0 0 '3' 'm'
subplot 3 2 5 '':title 'InPlot':box
inplot 0.4 1 0.6 1 on:box 'r'
multiplot 3 2 1 2 1 '':title 'MultiPlot and ShearPlot':box
shearplot 3 0 0.2 0.1:box 'r':text 0 0 '0' 'r'
shearplot 3 1 0.2 0.1:box 'g':text 0 0 '1' 'g'
shearplot 3 2 0.2 0.1:box 'b':text 0 0 '2' 'b'
C++ code:
void smgl_inplot(mglGraph *gr)
{
	gr->SubPlot(3,2,0);	gr->Title("StickPlot");
	gr->StickPlot(3, 0, 20, 30);	gr->Box("r");	gr->Puts(mglPoint(0),"0","r");
	gr->StickPlot(3, 1, 20, 30);	gr->Box("g");	gr->Puts(mglPoint(0),"1","g");
	gr->StickPlot(3, 2, 20, 30);	gr->Box("b");	gr->Puts(mglPoint(0),"2","b");
	gr->SubPlot(3,2,3,"");	gr->Title("ColumnPlot");
	gr->ColumnPlot(3, 0);	gr->Box("r");	gr->Puts(mglPoint(0),"0","r");
	gr->ColumnPlot(3, 1);	gr->Box("g");	gr->Puts(mglPoint(0),"1","g");
	gr->ColumnPlot(3, 2);	gr->Box("b");	gr->Puts(mglPoint(0),"2","b");
	gr->SubPlot(3,2,4,"");	gr->Title("GridPlot");
	gr->GridPlot(2, 2, 0);	gr->Box("r");	gr->Puts(mglPoint(0),"0","r");
	gr->GridPlot(2, 2, 1);	gr->Box("g");	gr->Puts(mglPoint(0),"1","g");
	gr->GridPlot(2, 2, 2);	gr->Box("b");	gr->Puts(mglPoint(0),"2","b");
	gr->GridPlot(2, 2, 3);	gr->Box("m");	gr->Puts(mglPoint(0),"3","m");
	gr->SubPlot(3,2,5,"");	gr->Title("InPlot");	gr->Box();
	gr->InPlot(0.4, 1, 0.6, 1, true);	gr->Box("r");
	gr->MultiPlot(3,2,1, 2, 1,"");	gr->Title("MultiPlot and ShearPlot");	gr->Box();
	gr->ShearPlot(3, 0, 0.2, 0.1);	gr->Box("r");	gr->Puts(mglPoint(0),"0","r");
	gr->ShearPlot(3, 1, 0.2, 0.1);	gr->Box("g");	gr->Puts(mglPoint(0),"1","g");
	gr->ShearPlot(3, 2, 0.2, 0.1);	gr->Box("b");	gr->Puts(mglPoint(0),"2","b");
}
