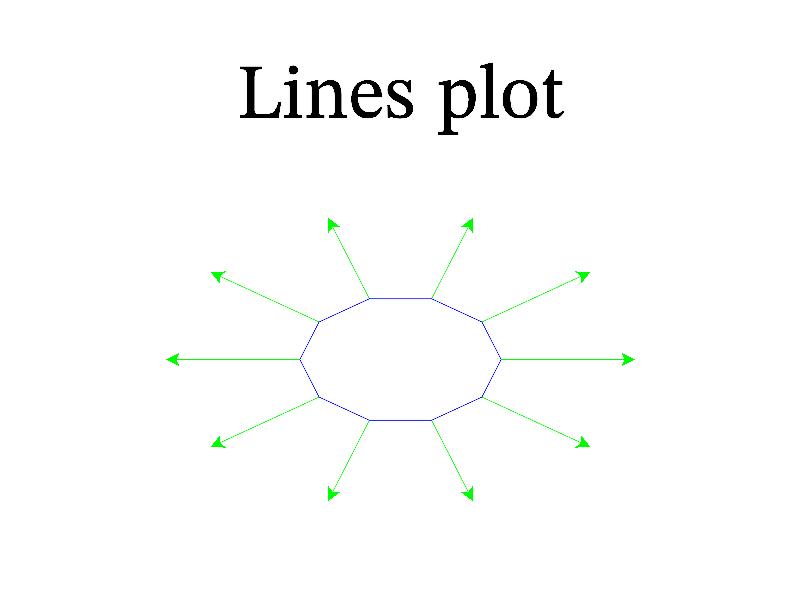
11.76 Sample ‘lines’ 
Function lines draw a set of lines.
MGL code:
subplot 1 1 0 '':title 'Lines plot'
new x1 11 '0.3*cos(pi*i/5)'
new y1 11 '0.3*sin(pi*i/5)'
new x2 11 '0.7*cos(pi*i/5)'
new y2 11 '0.7*sin(pi*i/5)'
plot x1 y1
lines x1 y1 x2 y2 '_A'
C++ code:
void smgl_lines(mglGraph *gr)
{
	mglData x1(11),y1(11),x2(11),y2(11);
	for(long i=0;i<11;i++)
	{
		x1.a[i] = 0.3*cos(M_PI*i/5);
		y1.a[i] = 0.3*sin(M_PI*i/5);
		x2.a[i] = 0.7*cos(M_PI*i/5);
		y2.a[i] = 0.7*sin(M_PI*i/5);
	}
	if(big!=3)	{gr->SubPlot(1,1,0,"");	gr->Title("Lines plot");}
	gr->Plot(x1,y1);
	gr->Lines(x1,y1,x2,y2,"_A");
}