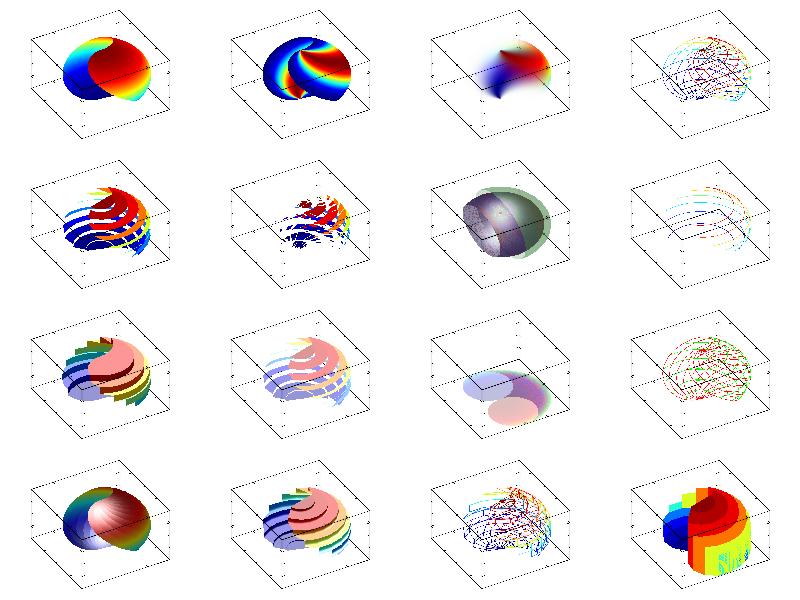
11.89 Sample ‘param2’ 
Example of parametric plots for 2D data.
MGL code:
new x 100 100 'sin(pi*(x+y)/2)*cos(pi*y/2)'
new y 100 100 'cos(pi*(x+y)/2)*cos(pi*y/2)'
new z 100 100 'sin(pi*y/2)'
new c 100 100 'cos(pi*x)'

subplot 4 4 0:rotate 40 60:box:surf x y z
subplot 4 4 1:rotate 40 60:box:surfc x y z c
subplot 4 4 2:rotate 40 60:box:surfa x y z c;alpha 1
subplot 4 4 3:rotate 40 60:box:mesh x y z;meshnum 10
subplot 4 4 4:rotate 40 60:box:tile x y z;meshnum 10
subplot 4 4 5:rotate 40 60:box:tiles x y z c;meshnum 10
subplot 4 4 6:rotate 40 60:box:axial x y z;alpha 0.5;light on
subplot 4 4 7:rotate 40 60:box:cont x y z
subplot 4 4 8:rotate 40 60:box:contf x y z;light on:contv x y z;light on
subplot 4 4 9:rotate 40 60:box:belt x y z 'x';meshnum 10;light on
subplot 4 4 10:rotate 40 60:box:dens x y z;alpha 0.5
subplot 4 4 11:rotate 40 60:box
fall x y z 'g';meshnum 10:fall x y z 'rx';meshnum 10
subplot 4 4 12:rotate 40 60:box:belt x y z '';meshnum 10;light on
subplot 4 4 13:rotate 40 60:box:boxs x y z '';meshnum 10;light on
subplot 4 4 14:rotate 40 60:box:boxs x y z '#';meshnum 10;light on
subplot 4 4 15:rotate 40 60:box:boxs x y z '@';meshnum 10;light on
C++ code:
void smgl_param2(mglGraph *gr)	// 2d parametric plots
{
	mglData x(100,100), y(100,100), z(100,100), c(100,100);
	gr->Fill(x,"sin(pi*(x+y)/2)*cos(pi*y/2)");	gr->Fill(y,"cos(pi*(x+y)/2)*cos(pi*y/2)");
	gr->Fill(z,"sin(pi*y/2)");	gr->Fill(c,"cos(pi*x)");

	gr->SubPlot(4,4,0);	gr->Rotate(40,60);	gr->Box();	gr->Surf(x,y,z);
	gr->SubPlot(4,4,1);	gr->Rotate(40,60);	gr->Box();	gr->SurfC(x,y,z,c);
	gr->SubPlot(4,4,2);	gr->Rotate(40,60);	gr->Box();	gr->SurfA(x,y,z,c,"","alpha 1");
	gr->SubPlot(4,4,3);	gr->Rotate(40,60);	gr->Box();	gr->Mesh(x,y,z,"","meshnum 10");
	gr->SubPlot(4,4,4);	gr->Rotate(40,60);	gr->Box();	gr->Tile(x,y,z,"","meshnum 10");
	gr->SubPlot(4,4,5);	gr->Rotate(40,60);	gr->Box();	gr->TileS(x,y,z,c,"","meshnum 10");
	gr->SubPlot(4,4,6);	gr->Rotate(40,60);	gr->Box();	gr->Axial(x,y,z,"","alpha 0.5;light on");
	gr->SubPlot(4,4,7);	gr->Rotate(40,60);	gr->Box();	gr->Cont(x,y,z);
	gr->SubPlot(4,4,8);	gr->Rotate(40,60);	gr->Box();	gr->ContF(x,y,z,"","light on");	gr->ContV(x,y,z,"","light on");
	gr->SubPlot(4,4,9);	gr->Rotate(40,60);	gr->Box();	gr->Belt(x,y,z,"x","meshnum 10;light on");
	gr->SubPlot(4,4,10);gr->Rotate(40,60);	gr->Box();	gr->Dens(x,y,z,"","alpha 0.5");
	gr->SubPlot(4,4,11);gr->Rotate(40,60);	gr->Box();
	gr->Fall(x,y,z,"g","meshnum 10");	gr->Fall(x,y,z,"rx","meshnum 10");
	gr->SubPlot(4,4,12);	gr->Rotate(40,60);	gr->Box();	gr->Belt(x,y,z,"","meshnum 10;light on");
	gr->SubPlot(4,4,13);	gr->Rotate(40,60);	gr->Box();	gr->Boxs(x,y,z,"","meshnum 10;light on");
	gr->SubPlot(4,4,14);	gr->Rotate(40,60);	gr->Box();	gr->Boxs(x,y,z,"#","meshnum 10");
	gr->SubPlot(4,4,15);	gr->Rotate(40,60);	gr->Box();	gr->Boxs(x,y,z,"@","meshnum 10;light on");
}
