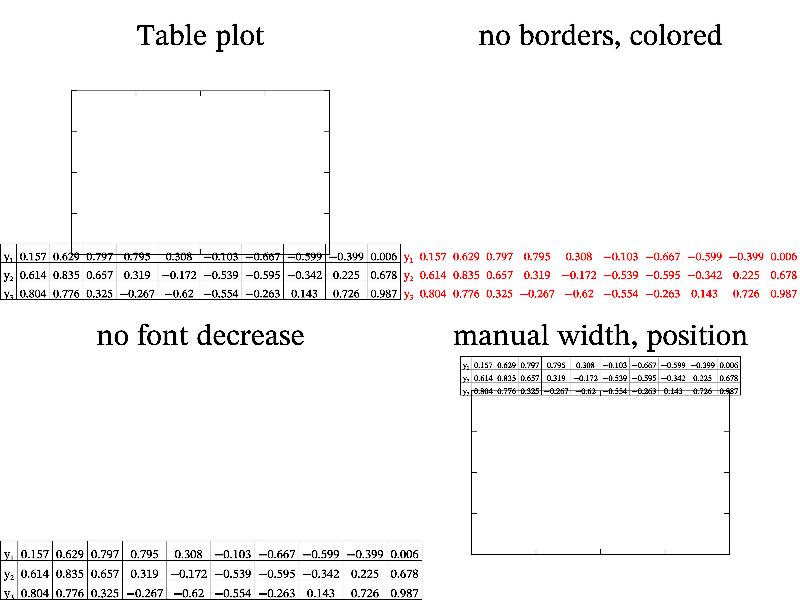
11.131 Sample ‘table’ 
Function table draw table with data values.
MGL code:
new ys 10 3 '0.8*sin(pi*(x+y/4+1.25))+0.2*rnd'
subplot 2 2 0:title 'Table sample':box
table ys 'y_1\n{}y_2\n{}y_3'

subplot 2 2 1:title 'no borders, colored'
table ys 'y_1\n{}y_2\n{}y_3' 'r|'

subplot 2 2 2:title 'no font decrease'
table ys 'y_1\n{}y_2\n{}y_3' '#'

subplot 2 2 3:title 'manual width and position':box
table 0.5 0.95 ys 'y_1\n{}y_2\n{}y_3' '#';value 0.7
C++ code:
void smgl_table(mglGraph *gr)
{
	mglData ys(10,3);	ys.Modify("0.8*sin(pi*(2*x+y/2))+0.2*rnd");
	if(big!=3)	{	gr->SubPlot(2,2,0);	gr->Title("Table plot");	}
	gr->Table(ys,"y_1\ny_2\ny_3");	gr->Box();
	if(big==3)	return;
	gr->SubPlot(2,2,1);	gr->Title("no borders, colored");
	gr->Table(ys,"y_1\ny_2\ny_3","r|");
	gr->SubPlot(2,2,2);	gr->Title("no font decrease");
	gr->Table(ys,"y_1\ny_2\ny_3","#");
	gr->SubPlot(2,2,3);	gr->Title("manual width, position");
	gr->Table(0.5, 0.95, ys,"y_1\ny_2\ny_3","#", "value 0.7");	gr->Box();
}