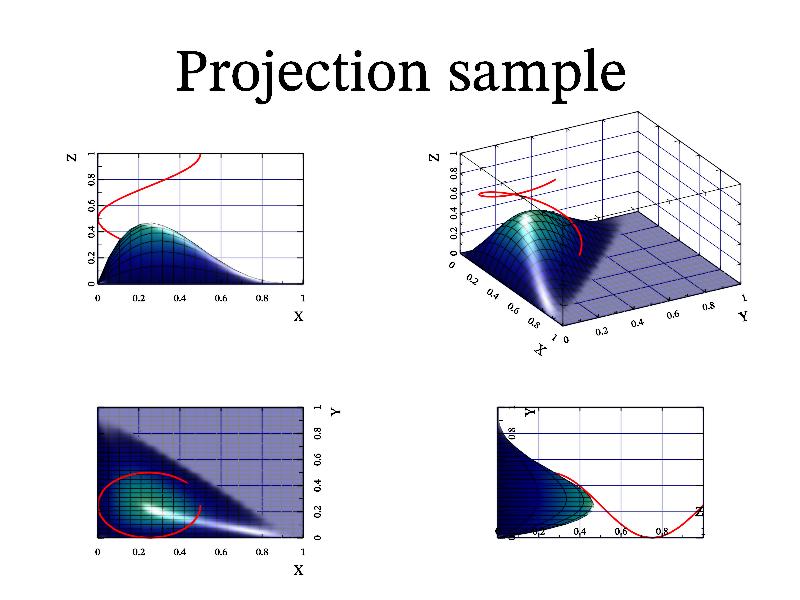
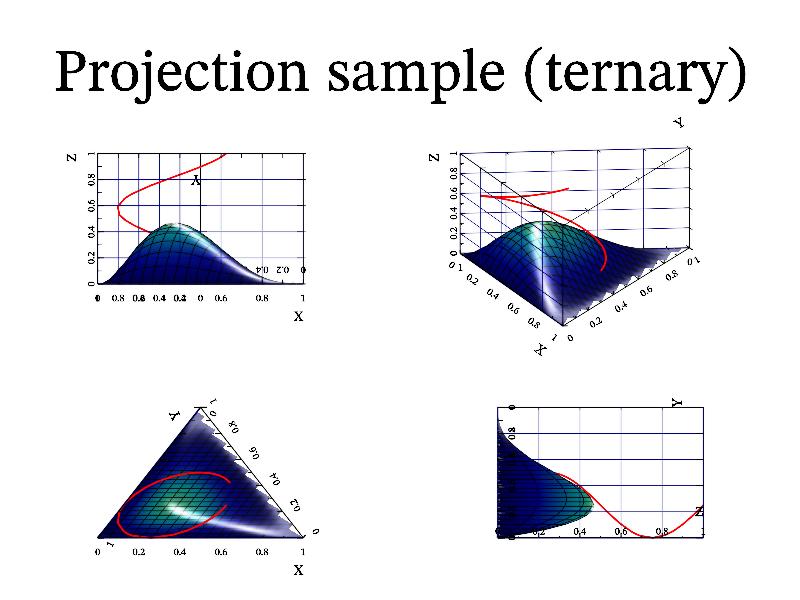
3.5.4 Axis projection 
You can easily make 3D plot and draw its x-,y-,z-projections (like in CAD) by using ternary function with arguments: 4 for Cartesian, 5 for Ternary and 6 for Quaternary coordinates. The sample code is:
int sample(mglGraph *gr)
{
  gr->SetRanges(0,1,0,1,0,1);
  mglData x(50),y(50),z(50),rx(10),ry(10), a(20,30);
  a.Modify("30*x*y*(1-x-y)^2*(x+y<1)");
  x.Modify("0.25*(1+cos(2*pi*x))");
  y.Modify("0.25*(1+sin(2*pi*x))");
  rx.Modify("rnd"); ry.Modify("(1-v)*rnd",rx);
  z.Modify("x");

  gr->Title("Projection sample");
  gr->Ternary(4);
  gr->Rotate(50,60);      gr->Light(true);
  gr->Plot(x,y,z,"r2");   gr->Surf(a,"#");
  gr->Axis(); gr->Grid(); gr->Box();
  gr->Label('x',"X",1);   gr->Label('y',"Y",1);   gr->Label('z',"Z",1);
}