3.5.1 “Compound” graphics 
As I noted above, MathGL functions (except the special one, like Clf()) do not erase the previous plotting but just add the new one. It allows one to draw “compound” plots easily. For example, popular Matlab command surfc can be emulated in MathGL by 2 calls:
  Surf(a);
  Cont(a, "_");     // draw contours at bottom
Here a is 2-dimensional data for the plotting, -1 is the value of z-coordinate at which the contour should be plotted (at the bottom in this example). Analogously, one can draw density plot instead of contour lines and so on.
Another nice plot is contour lines plotted directly on the surface:
  Light(true);       // switch on light for the surface
  Surf(a, "BbcyrR"); // select 'jet' colormap for the surface
  Cont(a, "y");      // and yellow color for contours
The possible difficulties arise in black&white case, when the color of the surface can be close to the color of a contour line. In that case I may suggest the following code:
  Light(true);   // switch on light for the surface
  Surf(a, "kw"); // select 'gray' colormap for the surface
  CAxis(-1,0);   // first draw for darker surface colors
  Cont(a, "w");  // white contours
  CAxis(0,1);    // now draw for brighter surface colors
  Cont(a, "k");  // black contours
  CAxis(-1,1);   // return color range to original state
The idea is to divide the color range on 2 parts (dark and bright) and to select the contrasting color for contour lines for each of part.
Similarly, one can plot flow thread over density plot of vector field amplitude (this is another amusing plot from Matlab) and so on. The list of compound graphics can be prolonged but I hope that the general idea is clear.
Just for illustration I put here following sample code:
int sample(mglGraph *gr)
{
mglData a,b,d; mgls_prepare2v(&a,&b); d = a;
for(int i=0;i<a.nx*a.ny;i++) d.a[i] = hypot(a.a[i],b.a[i]);
mglData c; mgls_prepare3d(&c);
mglData v(10); v.Fill(-0.5,1);
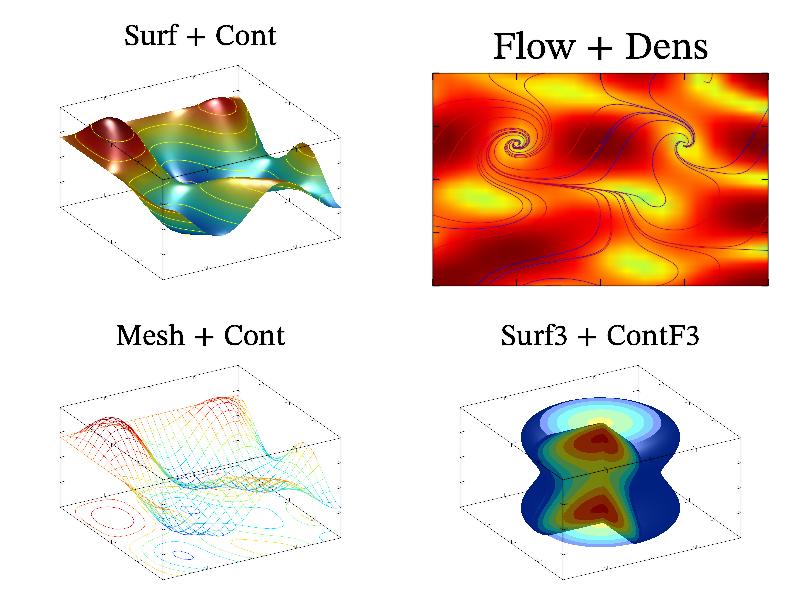
gr->SubPlot(2,2,1,""); gr->Title("Flow + Dens");
gr->Flow(a,b,"br"); gr->Dens(d,"BbcyrR"); gr->Box();
gr->SubPlot(2,2,0); gr->Title("Surf + Cont"); gr->Rotate(50,60);
gr->Light(true); gr->Surf(a); gr->Cont(a,"y"); gr->Box();
gr->SubPlot(2,2,2); gr->Title("Mesh + Cont"); gr->Rotate(50,60);
gr->Box(); gr->Mesh(a); gr->Cont(a,"_");
gr->SubPlot(2,2,3); gr->Title("Surf3 + ContF3");gr->Rotate(50,60);
gr->Box(); gr->ContF3(v,c,"z",0); gr->ContF3(v,c,"x"); gr->ContF3(v,c);
gr->SetCutBox(mglPoint(0,-1,-1), mglPoint(1,0,1.1));
gr->ContF3(v,c,"z",c.nz-1); gr->Surf3(-0.5,c);
return 0;
}