4.4 Color scheme 
The color scheme is used for determining the color of surfaces, isolines, isosurfaces and so on. The color scheme is defined by the string, which may contain several characters that are color id (see Line styles) or characters ‘#:|’. Symbol ‘#’ switches to mesh drawing or to a wire plot. Symbol ‘|’ disables color interpolation in color scheme, which can be useful, for example, for sharp colors during matrix plotting. Symbol ‘:’ terminate the color scheme parsing. Following it, the user may put styles for the text, rotation axis for curves/isocontours, and so on. Color scheme may contain up to 32 color values.
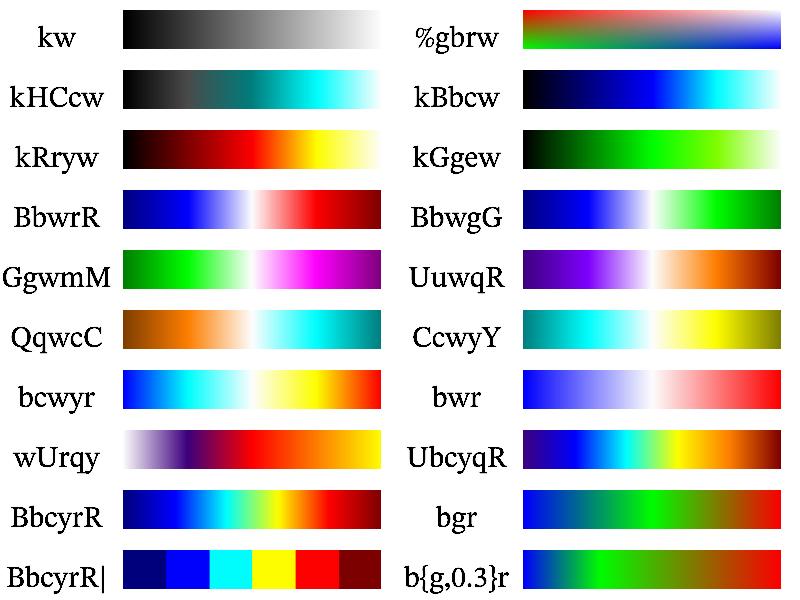
The final color is a linear interpolation of color array. The color array is constructed from the string ids (including “bright” colors, see Color styles). The argument is the amplitude normalized in color range (see Axis settings). For example, string containing 4 characters ‘bcyr’ corresponds to a colorbar from blue (lowest value) through cyan (next value) through yellow (next value) to the red (highest value). String ‘kw’ corresponds to a colorbar from black (lowest value) to white (highest value). String ‘m’ corresponds to a simple magenta color.
The special 2-axis color scheme (like in map plot) can be used if it contain symbol ‘%’. In this case the second direction (alpha channel) is used as second coordinate for colors. At this, up to 4 colors can be specified for corners: {c1,a1}, {c2,a1}, {c1,a2}, {c2,a2}. Here color and alpha ranges are {c1,c2} and {a1,a2} correspondingly. If one specify less than 4 colors then black color is used for corner {c1,a1}. If only 2 colors are specified then the color of their sum is used for corner {c2,a2}.
There are several useful combinations. String ‘kw’ corresponds to the simplest gray color scheme where higher values are brighter. String ‘wk’ presents the inverse gray color scheme where higher value is darker. Strings ‘kRryw’, ‘kGgw’, ‘kBbcw’ present the well-known hot, summer and winter color schemes. Strings ‘BbwrR’ and ‘bBkRr’ allow one to view bi-color figure on white or black background, where negative values are blue and positive values are red. String ‘BbcyrR’ gives a color scheme similar to the well-known jet color scheme.
For more precise coloring, you can change default (equidistant) position of colors in color scheme. The format is ‘{CN,pos}’, ‘{CN,pos}’ or ‘{xRRGGBB,pos}’. The position value pos should be in range [0, 1]. Note, that alternative method for fine tuning of the color scheme is using the formula for coloring (see Curved coordinates).
When coloring by coordinate (used in map), the final color is determined by the position of the point in 3d space and is calculated from formula c=x*c[1] + y*c[2]. Here, c[1], c[2] are the first two elements of color array; x, y are normalized to axis range coordinates of the point.
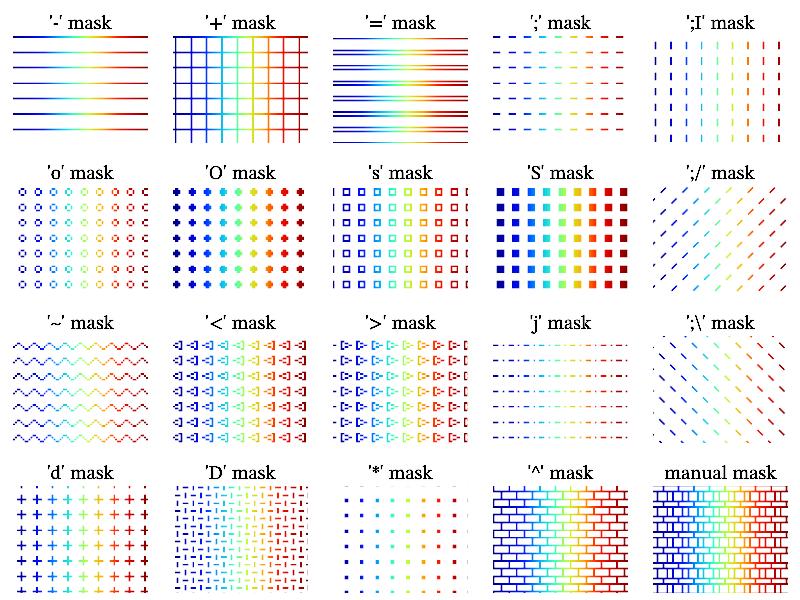
Additionally, MathGL can apply mask to face filling at bitmap rendering. The kind of mask is specified by one of symbols ‘-+=;oOsS~<>jdD*^’ in color scheme. Mask can be rotated by arbitrary angle by command mask or by three predefined values +45, -45 and 90 degree by symbols ‘\/I’ correspondingly. Examples of predefined masks are shown on the figure below.
However, you can redefine mask for one symbol by specifying new matrix of size 8*8 as second argument for mask command. For example, the right-down subplot on the figure above is produced by code
gr->SetMask('+', "ff00182424f800"); gr->Dens(a,"3+");
or just use manual mask style (for v.2.3 and later)
gr->Dens(a,"3{s00ff00182424f800}");

