Next: Radar sample, Up: 1D samples [Contents][Index]
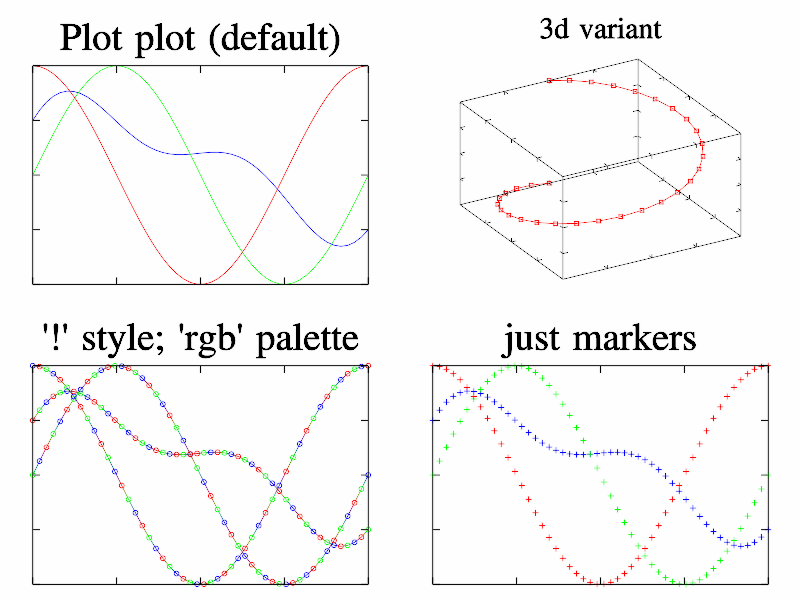
Function plot is most standard way to visualize 1D data array. By default, Plot use colors from palette. However, you can specify manual color/palette, and even set to use new color for each points by using ‘!’ style. Another feature is ‘ ’ style which draw only markers without line between points. The sample code is:
int sample(mglGraph *gr)
{
  mglData y;  mgls_prepare1d(&y); gr->SetOrigin(0,0,0);
  gr->SubPlot(2,2,0,"");  gr->Title("Plot plot (default)");
  gr->Box();  gr->Plot(y);

  gr->SubPlot(2,2,2,"");  gr->Title("'!' style; 'rgb' palette");
  gr->Box();  gr->Plot(y,"o!rgb");

  gr->SubPlot(2,2,3,"");  gr->Title("just markers");
  gr->Box();  gr->Plot(y," +");

  gr->SubPlot(2,2,1); gr->Title("3d variant");
  gr->Rotate(50,60);  gr->Box();
  mglData yc(30), xc(30), z(30);  z.Modify("2*x-1");
  yc.Modify("sin(pi*(2*x-1))"); xc.Modify("cos(pi*2*x-pi)");
  gr->Plot(xc,yc,z,"rs");
  return 0;
}
Next: Radar sample, Up: 1D samples [Contents][Index]