Next: Step sample, Previous: Plot sample, Up: 1D samples [Contents][Index]
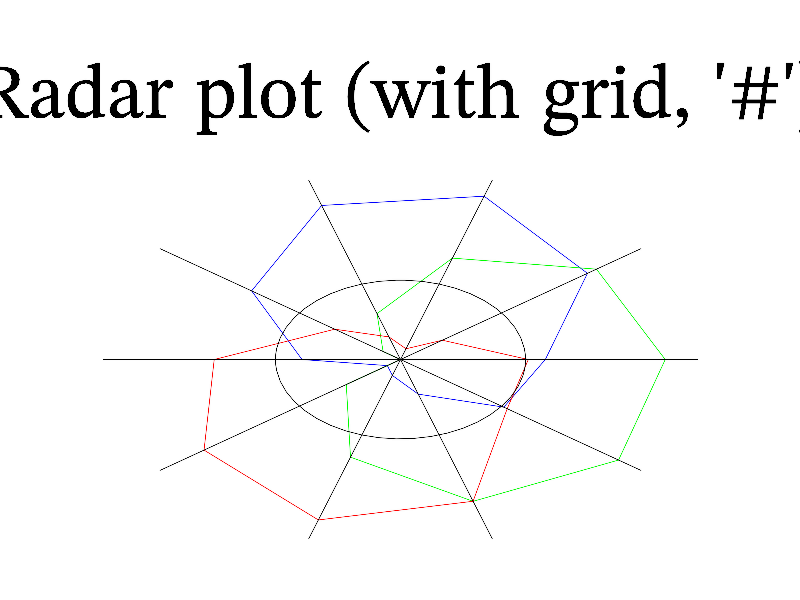
Function radar plot is variant of Plot one, which make plot in polar coordinates and draw radial rays in point directions. If you just need a plot in polar coordinates then I recommend to use Curvilinear coordinates or Plot in parabolic form with x=r*cos(fi); y=r*sin(fi);. The sample code is:
int sample(mglGraph *gr)
{
  mglData yr(10,3); yr.Modify("0.4*sin(pi*(2*x+y))+0.1*rnd");
  gr->SubPlot(1,1,0,"");  gr->Title("Radar plot (with grid, '\\#')");
  gr->Radar(yr,"#");
  return 0;
}