Next: Vect3 sample, Up: Vector field samples [Contents][Index]
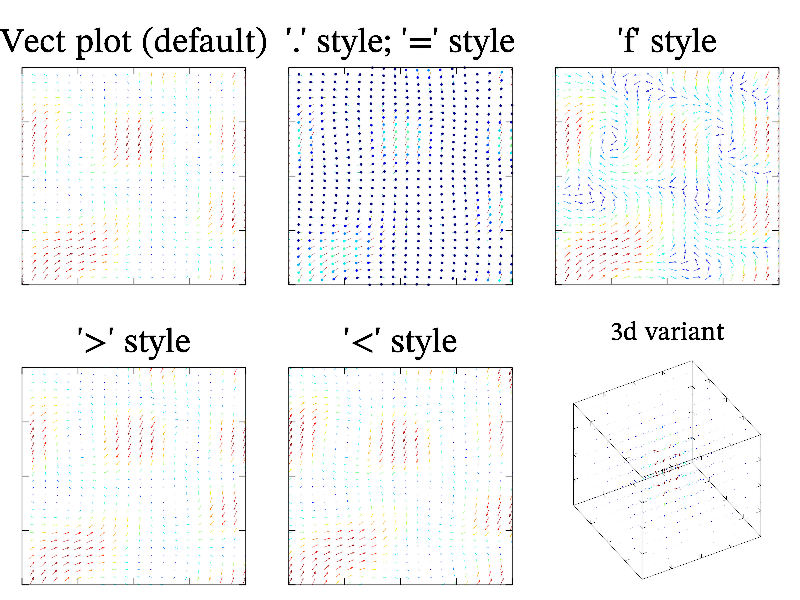
Function vect is most standard way to visualize vector fields – it draw a lot of arrows or hachures for each data cell. It have a lot of options which can be seen on the figure (and in the sample code). Vect use color scheme for coloring (see Color scheme). The sample code is:
int sample(mglGraph *gr)
{
  mglData a,b;  mgls_prepare2v(&a,&b);
  gr->SubPlot(3,2,0,""); gr->Title("Vect plot (default)");
  gr->Box();  gr->Vect(a,b);

  gr->SubPlot(3,2,1,"");  gr->Title("'.' style; '=' style");
  gr->Box();  gr->Vect(a,b,"=.");

  gr->SubPlot(3,2,2,"");  gr->Title("'f' style");
  gr->Box();  gr->Vect(a,b,"f");

  gr->SubPlot(3,2,3,"");  gr->Title("'>' style");
  gr->Box();  gr->Vect(a,b,">");

  gr->SubPlot(3,2,4,"");  gr->Title("'<' style");
  gr->Box();  gr->Vect(a,b,"<");

  mglData ex,ey,ez; mgls_prepare3v(&ex,&ey,&ez);
  gr->SubPlot(3,2,5); gr->Title("3d variant");  gr->Rotate(50,60);
  gr->Box();  gr->Vect(ex,ey,ez);
  return 0;
}
Next: Vect3 sample, Up: Vector field samples [Contents][Index]